Update: I have a much better solution (and meter), the ECM1240 from Brultech, read about it here.
Ok, the title is a mouthful, but that's why it's been about 6 months since I started and I have results to show for it only now.
My goals were to get:
a daily summary of power use per hour
have enough data to recreate a PG&E bill on a daily basis before we get it (to be able to predict whether we're using electricity in the right amount and at the right time before getting the bill).
more importantly, be able to drill a bill down to the day and the hour (we have data updates every 2mn) and see how much more power the house is using if the dishwasher is on, or the electric toaster oven.
get a real sense of how much our AC is running and how much it costs.
For this, while ordering the Solar Panels (aka PV system) from Cobalt Power, I asked for a monitoring system and the only one they found at the time that would allow monitoring of both the PV production and the PG&E Meter was a third party One Meter from One Brand Electronics.
It looks like this:

the meter that does gathering and resending to my monitoring server
")
the probe gathering boxes (gets volts and amps)

this shows the CTs that measure current from their induced magnetic field
The voltage probes are simply connected to the lines and those are precise. Unfortunately, I don't care about voltage nearly as much as current sinc ethe voltage tends to be known and the current is what affects your bill.
It's a reasonably easy solution to add to any setup during or after the fact, but the low points with the Brand Electronics One Meter solution are:
by design the current measured is inexact. I see current used on the PV inverter when it's not supposed to use much of anything, and of course I also see random small currents in either direction on the AC when it's off.
while the data gathered is good enough for general trends, longer term use has shown that it can be off by as much as 40Kwh/month on my PG&E Meter, which is a fair amount.
the One Meter interface is really bad. I'm a linux CLI guy, but it is bad. It is impossible to change its basic configuration like what it sends over telnet and at what interval without having its firmware reburnt by onebrand, but get this: you can't even change the IP address it'll talk to either without sending it back.
it has a serial interface for configuration that is quite poor and it'll dump old data you might have missed in a different format that what it sends over telnet to make your life harder.
it is a very slow microcontroller that is so slow that it takes over one minute to send 12 samples of data
it is of course unable to set its own time over ntp and is unaware of DST, so I just put mine on UTC and I fix things on the server side.
last, but not least, it will randomly corrupt itself and send totally bogus data points. Thankfully it however recovers at the next sample. I had to write fairly complex code to analyse the data samples, detect and throw away bad ones.
Ok, so are you sold yet? :)
Well, it's not that bad now since I went through the effort of writing the code to deal with all this. So, if you were to get one, you'd be up and running pretty quickly if you can hack perl, the language I used for my magic script that does all the work (see the bottom of the page for source code).
The above script took a fair amount of time to write since outside of working around quirks in the One Meter output, I wrote in the PG&E billing logic for California and it is able to output per hour per day production and use, as well as equivalency in dollars. Converting into dollars make sense since with TOU (time of use pricing) you can end up with days where your used more than you produced, but the end bill is still negative.
This is a typical example of a summer day (July 8th picked at random):
Hourly Differences
00_:  0.9Kwh/$0.1 House|  0.0Kwh/$0.0 AC|  0.9Kwh/$0.1 HouseNoAC|  0.0Kwh/$0.0 PV|  0.9Kwh/$0.1 PG&E|
01_:  0.9Kwh/$0.1 House|  0.0Kwh/$0.0 AC|  0.9Kwh/$0.1 HouseNoAC|  0.0Kwh/$0.0 PV|  0.9Kwh/$0.1 PG&E|
02_:  1.0Kwh/$0.1 House|  0.0Kwh/$0.0 AC|  1.0Kwh/$0.1 HouseNoAC|  0.0Kwh/$0.0 PV|  1.0Kwh/$0.1 PG&E|
03_:  0.9Kwh/$0.1 House|  0.0Kwh/$0.0 AC|  0.9Kwh/$0.1 HouseNoAC|  0.0Kwh/$0.0 PV|  0.9Kwh/$0.1 PG&E|
04_:  0.9Kwh/$0.1 House|  0.0Kwh/$0.0 AC|  0.9Kwh/$0.1 HouseNoAC|  0.0Kwh/$0.0 PV|  0.9Kwh/$0.1 PG&E|
05_:  0.9Kwh/$0.1 House|  0.0Kwh/$0.0 AC|  0.9Kwh/$0.1 HouseNoAC|  0.0Kwh/$0.0 PV|  0.9Kwh/$0.1 PG&E|
06_:  0.9Kwh/$0.1 House|  0.0Kwh/$0.0 AC|  0.9Kwh/$0.1 HouseNoAC| -0.0Kwh/$0.0 PV|  0.8Kwh/$0.1 PG&E|
07_:  0.9Kwh/$0.1 House|  0.0Kwh/$0.0 AC|  0.9Kwh/$0.1 HouseNoAC| -0.7Kwh/$0.1 PV|  0.1Kwh/$0.0 PG&E|
08_:  0.9Kwh/$0.1 House|  0.0Kwh/$0.0 AC|  0.9Kwh/$0.1 HouseNoAC| -2.2Kwh/$0.2 PV| -1.3Kwh/$0.1 PG&E|
09_:  0.9Kwh/$0.1 House|  0.0Kwh/$0.0 AC|  0.9Kwh/$0.1 HouseNoAC| -3.2Kwh/$0.3 PV| -2.3Kwh/$0.2 PG&E|
10-:  0.8Kwh/$0.1 House|  0.0Kwh/$0.0 AC|  0.8Kwh/$0.1 HouseNoAC| -3.9Kwh/$0.6 PV| -3.1Kwh/$0.4 PG&E|
11-:  0.9Kwh/$0.1 House|  0.0Kwh/$0.0 AC|  0.9Kwh/$0.1 HouseNoAC| -4.3Kwh/$0.6 PV| -3.4Kwh/$0.5 PG&E|
12-:  0.8Kwh/$0.1 House|  0.0Kwh/$0.0 AC|  0.8Kwh/$0.1 HouseNoAC| -4.5Kwh/$0.6 PV| -3.6Kwh/$0.5 PG&E|
13~:  0.9Kwh/$0.3 House|  0.0Kwh/$0.0 AC|  0.9Kwh/$0.2 HouseNoAC| -4.4Kwh/$1.3 PV| -3.5Kwh/$1.0 PG&E|
14~:  0.8Kwh/$0.2 House|  0.0Kwh/$0.0 AC|  0.8Kwh/$0.2 HouseNoAC| -4.1Kwh/$1.2 PV| -3.2Kwh/$0.9 PG&E|
15~:  0.9Kwh/$0.3 House|  0.0Kwh/$0.0 AC|  0.9Kwh/$0.3 HouseNoAC| -3.3Kwh/$1.0 PV| -2.4Kwh/$0.7 PG&E|
16~:  0.9Kwh/$0.3 House|  0.0Kwh/$0.0 AC|  0.9Kwh/$0.3 HouseNoAC| -2.0Kwh/$0.6 PV| -1.1Kwh/$0.3 PG&E|
17~:  0.9Kwh/$0.3 House|  0.0Kwh/$0.0 AC|  0.9Kwh/$0.3 HouseNoAC| -0.8Kwh/$0.2 PV|  0.1Kwh/$0.0 PG&E|
18~:  0.9Kwh/$0.3 House|  0.0Kwh/$0.0 AC|  0.9Kwh/$0.3 HouseNoAC| -0.2Kwh/$0.1 PV|  0.7Kwh/$0.2 PG&E|
19~:  1.0Kwh/$0.3 House|  0.0Kwh/$0.0 AC|  1.0Kwh/$0.3 HouseNoAC| -0.1Kwh/$0.0 PV|  0.9Kwh/$0.3 PG&E|
20-:  1.0Kwh/$0.1 House|  0.0Kwh/$0.0 AC|  1.0Kwh/$0.1 HouseNoAC|  0.0Kwh/$0.0 PV|  1.0Kwh/$0.1 PG&E|
21-:  1.1Kwh/$0.2 House|  0.0Kwh/$0.0 AC|  1.1Kwh/$0.2 HouseNoAC|  0.0Kwh/$0.0 PV|  1.1Kwh/$0.2 PG&E|
22_:  1.0Kwh/$0.1 House|  0.0Kwh/$0.0 AC|  1.0Kwh/$0.1 HouseNoAC|  0.0Kwh/$0.0 PV|  1.1Kwh/$0.1 PG&E|
23_:  0.9Kwh/$0.1 House|  0.0Kwh/$0.0 AC|  0.9Kwh/$0.1 HouseNoAC|  0.0Kwh/$0.0 PV|  0.9Kwh/$0.1 PG&E|
----------------------------------------------------------------------------------------------------
Wed: 22.6Kwh/ $3.4House|  0.1Kwh/ $0.0AC| 22.5Kwh/ $3.4HouseNoAC| 34.7Kwh/-$6.7PV|-12.1Kwh/-$3.3PG&E|

Split per rate:
$.08 11.0Kwh/$0.93House|  0.0Kwh/$0.00AC| 10.9Kwh/$0.92HouseNoAC| -6.2Kwh/$0.52PV|  4.9Kwh/$0.41PG&E|
$.14  4.6Kwh/$0.67House|  0.0Kwh/$0.00AC|  4.6Kwh/$0.66HouseNoAC|-12.7Kwh/$1.83PV| -8.0Kwh/$1.16PG&E|
$.29  6.2Kwh/$1.83House|  0.0Kwh/$0.00AC|  6.2Kwh/$1.82HouseNoAC|-14.8Kwh/$4.35PV| -8.6Kwh/$2.52PG&E|

Solar panels produced  34.7Kwh during 12.10h, between 06:46:28 and 18:50:28
Yellow shows partial peak rates, where it's good to have the meter run backwards, and red for peak rates when it's even better. Unfortunately the solar panels are facing south east and south instead of south west where they would produce more when electricity is worth more.
That is a more interesting example in September showing that despite having used more electricity in a day than what was produced, the daily bill was still negative thanks to the time of use magic, even it our case where we only get partial benefit from TOU due to the sub optimal south east angle for some of our panels:
Hourly Differences
00_:  0.9Kwh/$0.1 House|  0.0Kwh/$0.0 AC|  0.9Kwh/$0.1 HouseNoAC|  0.0Kwh/$0.0 PV|  0.9Kwh/$0.1 PG&E|
01_:  1.0Kwh/$0.1 House|  0.0Kwh/$0.0 AC|  1.0Kwh/$0.1 HouseNoAC|  0.0Kwh/$0.0 PV|  1.0Kwh/$0.1 PG&E|
02_:  0.9Kwh/$0.1 House|  0.0Kwh/$0.0 AC|  0.9Kwh/$0.1 HouseNoAC|  0.0Kwh/$0.0 PV|  0.9Kwh/$0.1 PG&E|
03_:  0.9Kwh/$0.1 House|  0.0Kwh/$0.0 AC|  0.9Kwh/$0.1 HouseNoAC|  0.0Kwh/$0.0 PV|  0.9Kwh/$0.1 PG&E|
04_:  0.9Kwh/$0.1 House|  0.0Kwh/$0.0 AC|  0.9Kwh/$0.1 HouseNoAC|  0.0Kwh/$0.0 PV|  0.9Kwh/$0.1 PG&E|
05_:  0.9Kwh/$0.1 House|  0.0Kwh/$0.0 AC|  0.9Kwh/$0.1 HouseNoAC|  0.0Kwh/$0.0 PV|  0.9Kwh/$0.1 PG&E|
06_:  0.9Kwh/$0.1 House|  0.0Kwh/$0.0 AC|  0.9Kwh/$0.1 HouseNoAC|  0.0Kwh/$0.0 PV|  0.9Kwh/$0.1 PG&E|
07_:  0.9Kwh/$0.1 House|  0.0Kwh/$0.0 AC|  0.9Kwh/$0.1 HouseNoAC| -0.1Kwh/$0.0 PV|  0.8Kwh/$0.1 PG&E|
08_:  0.9Kwh/$0.1 House|  0.0Kwh/$0.0 AC|  0.9Kwh/$0.1 HouseNoAC| -1.5Kwh/$0.1 PV| -0.7Kwh/$0.1 PG&E|
09_:  0.8Kwh/$0.1 House|  0.0Kwh/$0.0 AC|  0.8Kwh/$0.1 HouseNoAC| -2.8Kwh/$0.2 PV| -1.9Kwh/$0.2 PG&E|
10-:  0.9Kwh/$0.1 House|  0.0Kwh/$0.0 AC|  0.8Kwh/$0.1 HouseNoAC| -3.5Kwh/$0.5 PV| -2.6Kwh/$0.4 PG&E|
11-:  0.8Kwh/$0.1 House|  0.0Kwh/$0.0 AC|  0.8Kwh/$0.1 HouseNoAC| -3.9Kwh/$0.6 PV| -3.1Kwh/$0.4 PG&E|
12-:  0.8Kwh/$0.1 House|  0.0Kwh/$0.0 AC|  0.8Kwh/$0.1 HouseNoAC| -4.1Kwh/$0.6 PV| -3.2Kwh/$0.5 PG&E|
13~:  0.8Kwh/$0.2 House|  0.0Kwh/$0.0 AC|  0.8Kwh/$0.2 HouseNoAC| -4.0Kwh/$1.2 PV| -3.2Kwh/$0.9 PG&E|
14~:  0.8Kwh/$0.2 House|  0.0Kwh/$0.0 AC|  0.8Kwh/$0.2 HouseNoAC| -3.6Kwh/$1.0 PV| -2.8Kwh/$0.8 PG&E|
15~:  0.9Kwh/$0.3 House|  0.0Kwh/$0.0 AC|  0.8Kwh/$0.2 HouseNoAC| -2.2Kwh/$0.6 PV| -1.3Kwh/$0.4 PG&E|
16~:  0.9Kwh/$0.3 House|  0.0Kwh/$0.0 AC|  0.9Kwh/$0.3 HouseNoAC| -1.0Kwh/$0.3 PV| -0.1Kwh/$0.0 PG&E|
17~:  0.9Kwh/$0.3 House|  0.0Kwh/$0.0 AC|  0.9Kwh/$0.3 HouseNoAC| -0.1Kwh/$0.0 PV|  0.8Kwh/$0.2 PG&E|
18~:  0.9Kwh/$0.3 House|  0.0Kwh/$0.0 AC|  0.9Kwh/$0.3 HouseNoAC| -0.1Kwh/$0.0 PV|  0.8Kwh/$0.2 PG&E|
19~:  0.9Kwh/$0.3 House|  0.0Kwh/$0.0 AC|  0.9Kwh/$0.3 HouseNoAC|  0.0Kwh/$0.0 PV|  0.9Kwh/$0.3 PG&E|
20-:  0.9Kwh/$0.1 House|  0.0Kwh/$0.0 AC|  0.9Kwh/$0.1 HouseNoAC|  0.0Kwh/$0.0 PV|  0.9Kwh/$0.1 PG&E|
21-:  2.6Kwh/$0.4 House|  1.1Kwh/$0.2 AC|  1.5Kwh/$0.2 HouseNoAC|  0.0Kwh/$0.0 PV|  2.7Kwh/$0.4 PG&E|
22_:  3.2Kwh/$0.3 House|  1.1Kwh/$0.1 AC|  2.0Kwh/$0.2 HouseNoAC|  0.0Kwh/$0.0 PV|  3.2Kwh/$0.3 PG&E|
23_:  3.8Kwh/$0.3 House|  1.8Kwh/$0.2 AC|  2.0Kwh/$0.2 HouseNoAC|  0.0Kwh/$0.0 PV|  3.8Kwh/$0.3 PG&E|
----------------------------------------------------------------------------------------------------
Thu: 29.0Kwh/ $4.0House|  4.4Kwh/ $0.4AC| 24.7Kwh/ $3.6HouseNoAC| 27.6Kwh/-$5.2PV|  1.5Kwh/-$1.2PG&E|

Split per rate:
$.08 15.8Kwh/$1.34House|  3.0Kwh/$0.25AC| 12.9Kwh/$1.09HouseNoAC| -4.4Kwh/$0.37PV| 11.5Kwh/$0.97PG&E|
$.14  6.0Kwh/$0.87House|  1.1Kwh/$0.17AC|  4.9Kwh/$0.70HouseNoAC|-11.5Kwh/$1.66PV| -5.4Kwh/$0.78PG&E|
$.29  6.1Kwh/$1.79House|  0.0Kwh/$0.00AC|  6.1Kwh/$1.78HouseNoAC|-10.9Kwh/$3.19PV| -4.8Kwh/$1.40PG&E|

Solar panels produced  27.6Kwh during 10.20h, between 07:34:28 and 17:48:28
Now, a per hour text output is useful to see how we did on a given day, but it does not let you see your power usage in the last 10mn after you turned something big on or off, or how all of last week looked, or see a month's trend at a glance.
This is where cacti comes in. I spent a fair amount of time looking for a graphing solution that would keep all my data and let me zoom on any portions I wish. Quite frankly, the fancy widget that google uses in google finance would have been what I was really hoping for, but baring that, cacti came like a reasonable alternative.
So, I came up with a compound graph that looked reasonable, and the option to see all the graph items separately.
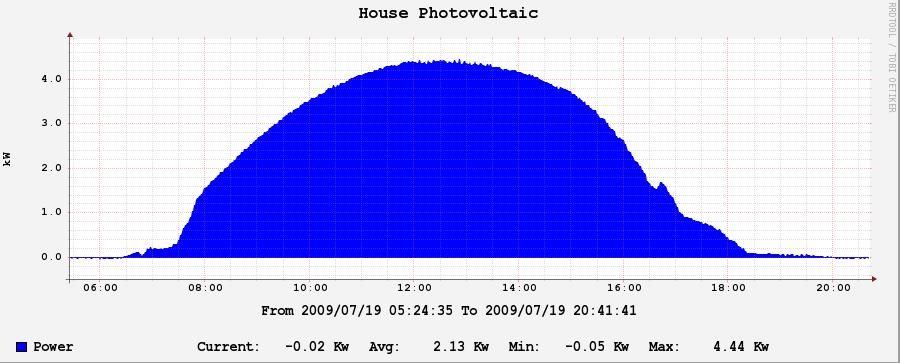
So since this is about solar panels, one of my questions to Cobalt Power was why my system was spec'ed for 5Kwh at peak and why I was typically seeing 4.5-4.7Kwh at best. The reason is that 2/3rd of the panels are pointing south-south-east and the remaining 3rd is pointing due south.
What this means is that our system doesn't actually peak at one time and then drop off. The graph clear shows that the PV production takes longer to peak and then stays at that lower peak a bit longer before dropping off more sharply. So, the production at the end of the day is still the same, but just with a slightly longer and slightly lower peak. Too bad the peak is on the morning side as opposed to the afternoon side when the electricity is worth more.
You'll also notice the sharp start which is when the sun goes high enough to reach the roof over the neighbours' houses across the street. You'll also notice the jigsaw drop on the way down as the sun starts to get hidden behind some branches in the high trees blocking our west view.
This graph and the graphs below are selected in zoom mode, so you can use the mouse cursor to draw a rectangle on a time region and the graph will refresh on the time slice you selected.
Below is a closeup of all the colors showing AC working hard in bursts while the black PG&E meter line goes from sometimes negative to always positive the green area of solar panel energy offset goes down to 0. Blue then shows the basic house energy usage with the red peaks on top showing AC tripling the house electricity use when it's running.
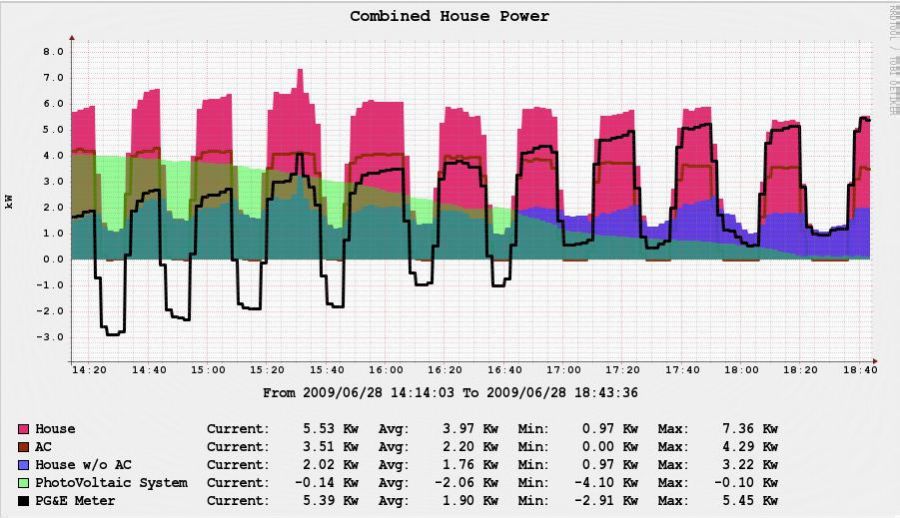
In other words: the red line is the AC use, the blue is the rest of the house use, red line goes on top of house use gives the red area which is total house use. You then remove green which is production from the solar panels and you end up with the black line which is what the PG&E meter actually sees. Confused yet? :)
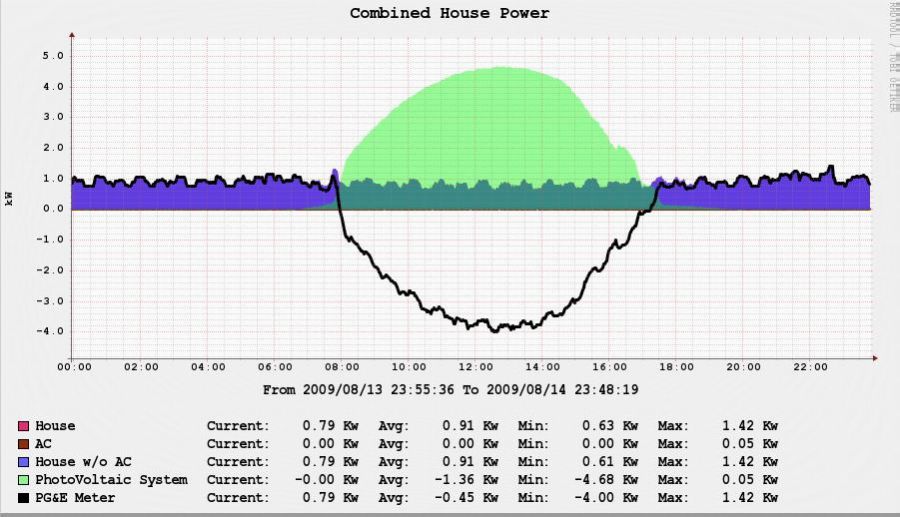
Here's a typical day without AC use since we weren't home:
Here's a very warm day with AC (keep in mind that you can zoom in by selecting a time slice with the mouse):
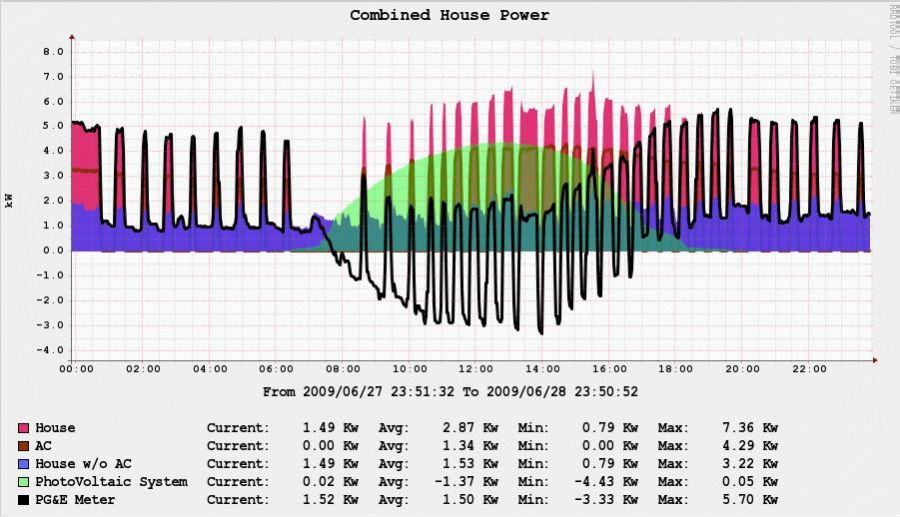
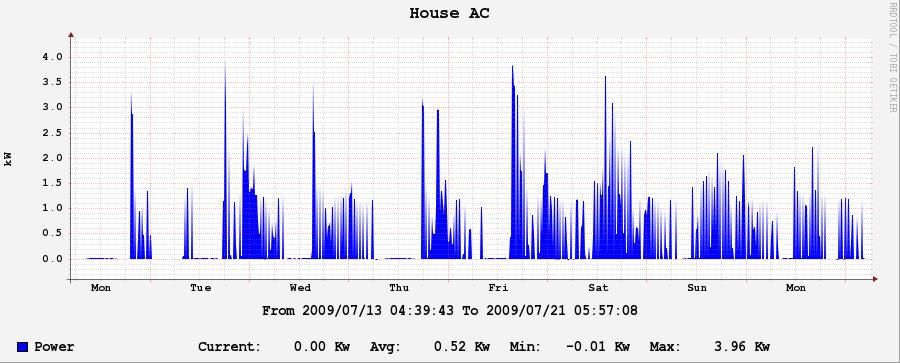
and a glance at just AC use during a few hot days in July:
Here is a link to an historical view of this graph at multiple time sample levels. Try the zoom function (magnifying mirror next to the graph) on the yearly graph at the bottom and you'll be able to zoom on random time in the past.
Another view is each probe graphed separately for a less cluttered view. Note that the AC view is pretty useless right now as it's only showing noise picked up by the coils, but if you click on it, you'll get the multiple timerange view as above and can view more interesting months, like the July zoom above.
What else?
Well, I had written some somewhat complex code to actually keep up of production for each tier and find out if I went into tier 2 to 5 (which pay or cost more per unit of energy), but because the One Meter gives me somewhat inaccurate readings, especially on the PG&E side, the numbers were just too far off to compute a bill that was close enough to the actual bill I was getting. So, I unfortunately had to give that part up.
It would otherwise have been nice to know in advance if my use or production for a given tier was going to exceed tier 1 and possibly adjust electricity use accordingly, but I'll need a more accurate measuring device than the One Brand one.
All this ended up being a fair amount of work, which with not that much extra work could have been a service that all solar companies sell. I think a few do, but I'm not sure if it's as complete as what I did, or if it is, please let me know so that I can compare with their work.
Anyway, if it's useful to you, here's the parsebrandpower script. Please note that if you were planning on taking it and selling service based on my work, it is protected by the GPL 3 copyright which you must understand and apply if you are going to use it. I also request that you contact me and let me know if you're going to use the code.
For more details on cacti integration, see my Gatewaying 1-wire, XPL (Oregon Scientify Weather), Brultech ECM1240 Power Data, and Brand OneMeter Data to cacti page.


")


")


")