Introduction
Until recently, I had a Brand One Powermeter to measure PG&E Meter, PV system and my AC. It was bulky, unreliable, and impossible to reprogram. In other words, it was a poor and expensive solution. That said, I still got some data and reasonable graphs from it as per this earlier blog post.
But let's be honest, I really didn't like that monitor and wanted to ditch it. After some research, the ECM1240 is the best feature/cost ratio power monitoring device I found (as of 2010). As of 2019, the ECM1240 is now obsolete and replaced by the Greeneye, see below:
_Note, there seems to be a better monitor now, the Greeneye._ You may want to have a look at Brultech Greeneye.
Why is it better than the alternatives?
Here's what it looks like:

the whole system

I calibrated the TTs vs the split 60CTs and the small CT-40s by comparing measurements of the same load

the 2 white boxes are the ECMs1240s, but I also have my older and bigger brand one power meters in there

the small donut CT-40s are great, they take no room at all
After getting this installed, I was able to get data on linux after I got a working but incomplete (for me) ecmread.py from prior authors, Brian Jackson, Kelvin Kakugawa, and Amit Snyderman. I modified it to support net metering and show high precision data as required by proper per second graphing in cacti.
Code
Gratuitous Graphs :)
Ok, first you can find all the graphs here: all regular owfs derived graphs.
And here are the interesting composite graphs.
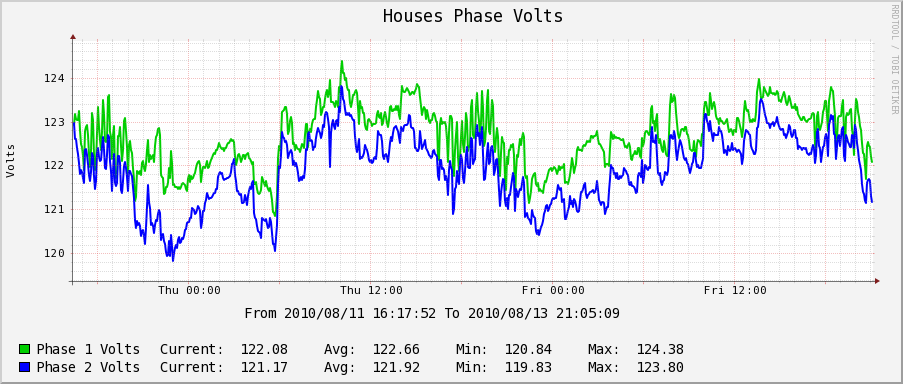
So, US houses come with 2 120V phases. Now, if you wanted 100% exact wattage measurements, you'd have to measure the voltage on each and every circuit breaker you measure, but in reality measuring each phase is close enough.
In real life, measuring amps on one phase with voltage from another phase will only give you about a 1-2% error at worst, so it's not a lot to agonize about. In my setup I tried to measure phase 2 loads on my ECM that's plugged into phase 2 power, but wasn't fully able to do it, and it's not meaningful when you measure 240V loads anyway.
This is what the phases look like, as the graph shows phase 1 typically gets more power than phase 2 for me, but depending on the load in my street and my house, they sometimes become close or equal:
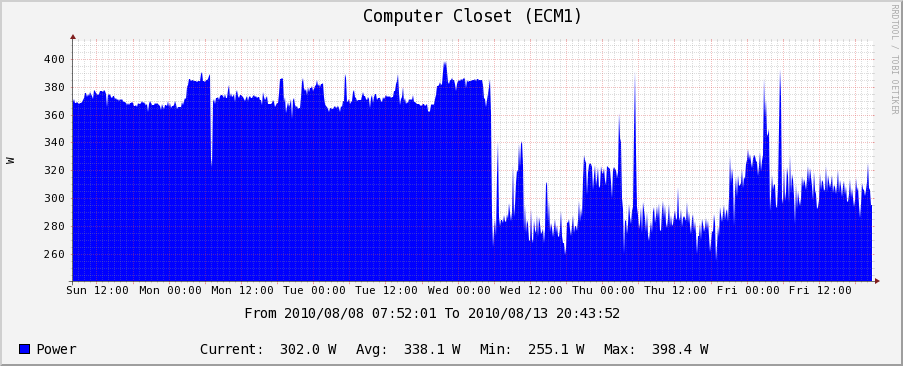
Of course, I have a lot of single interesting graphs. Can you tell when my disk to disk backup completed? :)
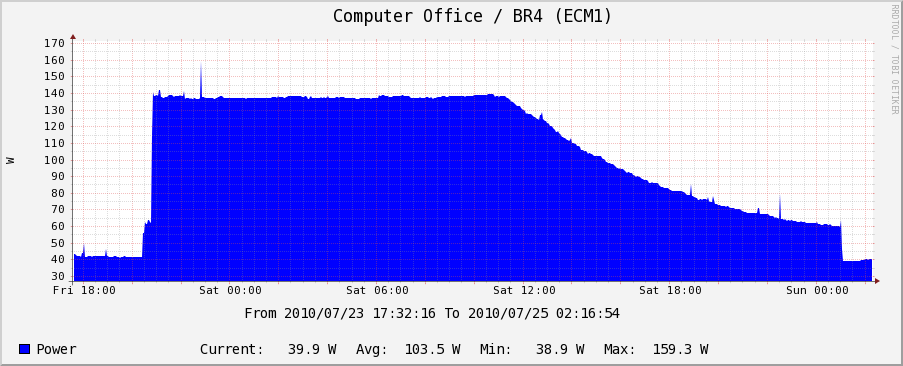
More importantly, and worryingly, compiling the same kernel took 30mn and 20W on my dual core duo laptop:
While compiling the same kernel on my dual Xeon P4 server took 2H and 80W-ish:
Another interesting graph was charging a 12V marine battery for my UPS:
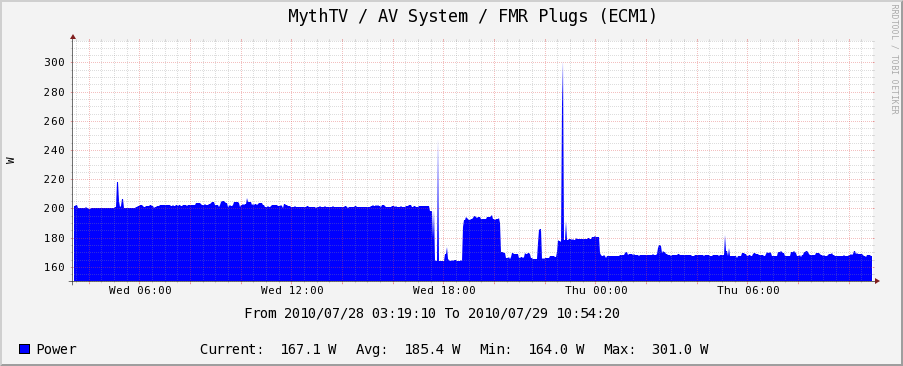
Thanks to this graph, I was able to find that my TV and speakers took 30W when off. I got a smart power strip that turns them off totally and saved about 30W off my base load:
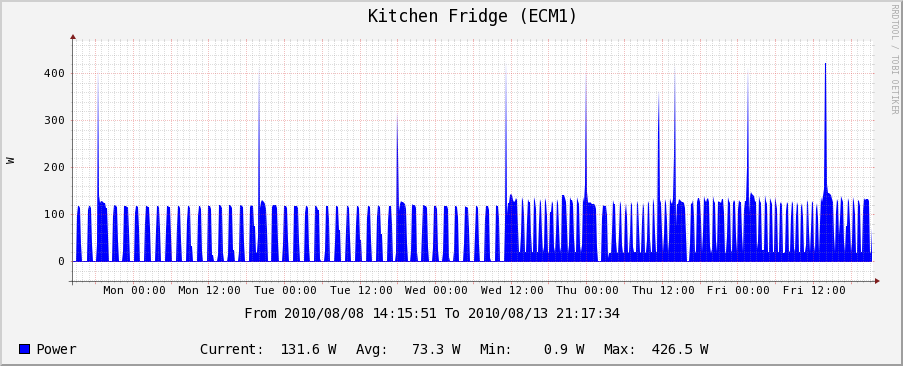
Ever wonder how much power your fridge is really using?
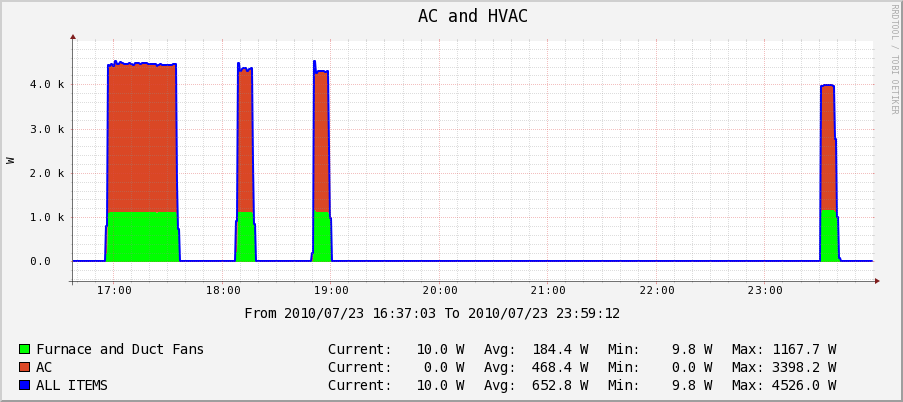
So, how much power does AC use? Well, not only 3500W for AC, but another 1000W for the whole house fans:
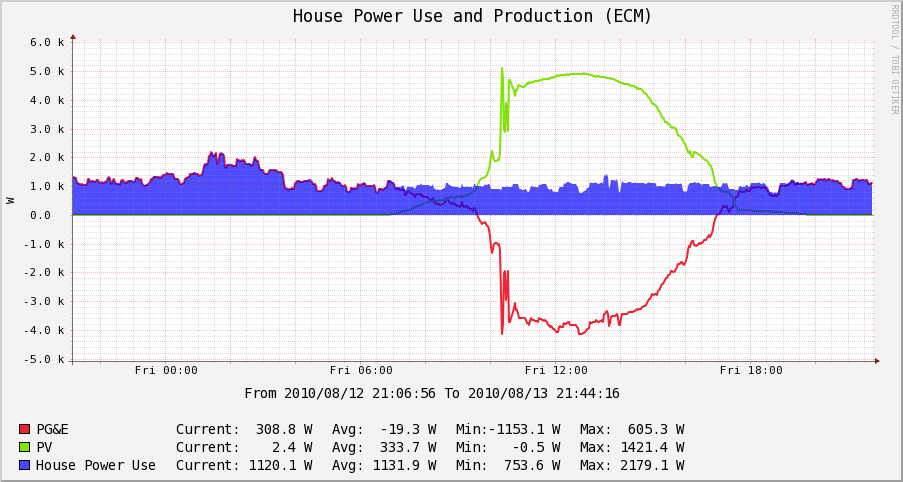
A cool graph showing House Power Use (calculated) from PG&E meter and PV production probe:
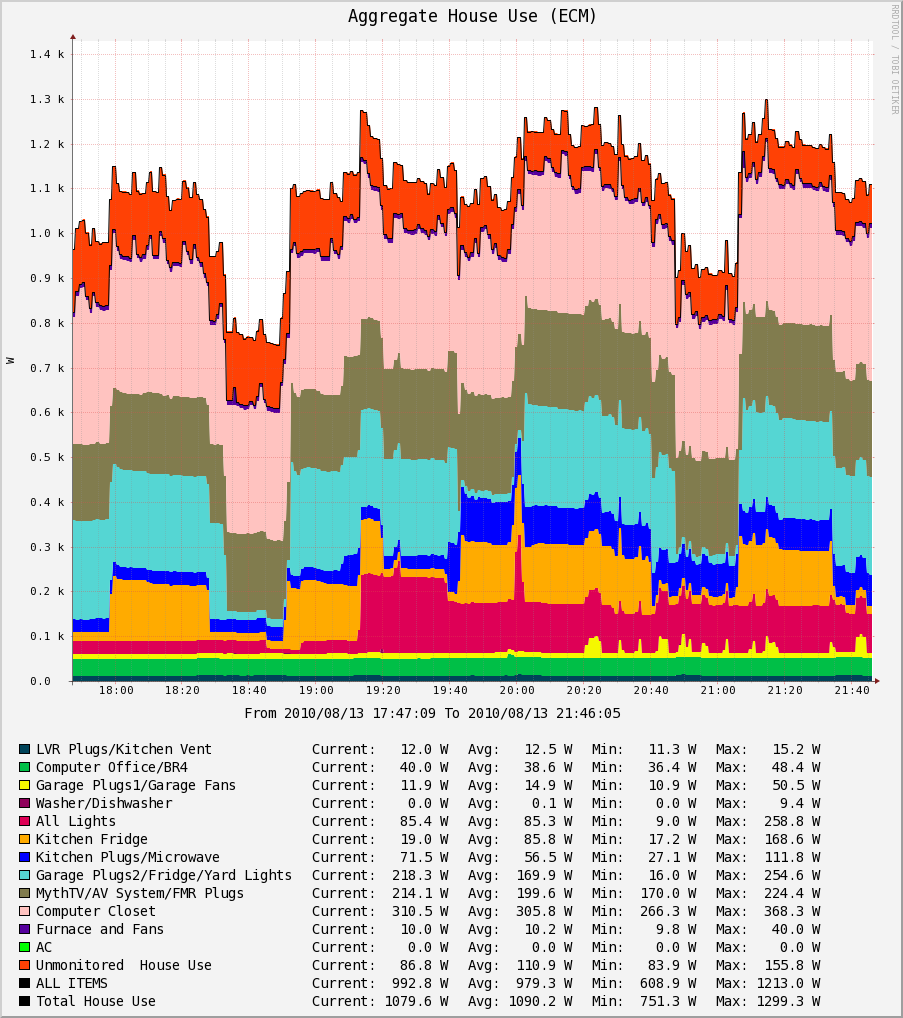
And for the money shot, all the house uses combined on one graph:
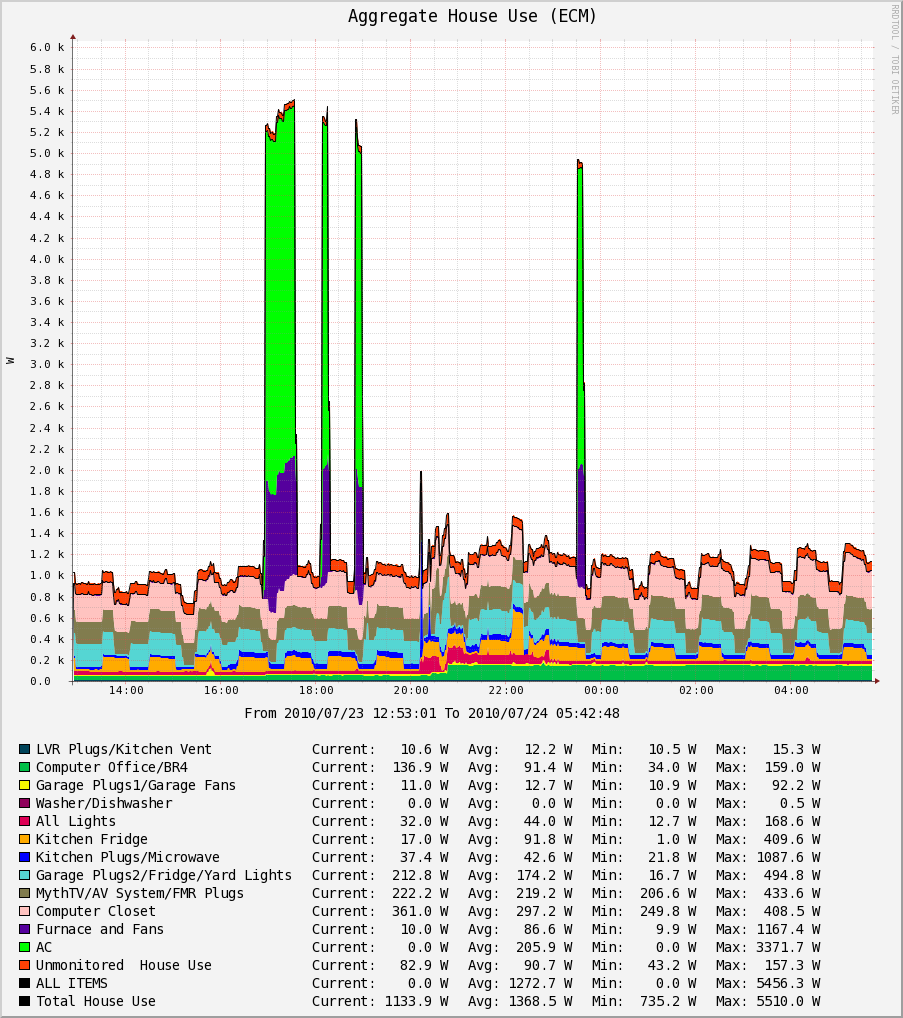
And the same graph, but with AC that was activated:
Setting up cacti
See my cacti config page.
Now, the tricky part is creating graph items that do not exist (like house use, or unmonitored house use). See this post I made on how to do this.
The other tricky part is that I had my ECM graphs setup to refresh every 10 seconds, which is faster than the cacti poller which runs every minute. This post explains how I did a faster than 1mn refresh in cacti