Marc's Public Blog - Solar Power


All | Aquariums | Arduino | Btrfs | Cars | Cats | Clubbing | Computers | Dining | Diving | Electronics | Exercising | Festivals | Flying | Halloween | Hiking | Linux | Linuxha | Monuments | Museums | Outings | Public | Rc | Sciencemuseums | Solar | Tfsf | Trips


Table of Content for solar:

More pages: January 2009 April 2009 November 2009 February 2010 March 2010 May 2010 June 2010 August 2010 March 2011 March 2012 July 2012 March 2013 March 2014 March 2015 March 2018 March 2019


2009/01/16 Solar Panels
π 2009-01-16 01:01 in Public, Solar
Around the time the garage was finished enough, I looked into solar panels for the house, because
  • the electricity bill was getting a bit steep (between $200 and $300 per month), although we found part of that bill was due to a broken high amperage fan that was running 24/7.
  • electricity rates just went up, and are scheduled to go up even higher
  • the federal tax credit for going solar became unlimited on how much it covers, making panels effectively half price between the CA and federal rebates (the federal credit used to be fairly curtailled).
  • the tech, cool, and green factors of course did not hurt :)

Solar & PG&E 101

So, one would think that getting solar panels is not that hard: you call a company over, they measure your roof space, your design factor (i.e. which way the roof is pointing as well as its inclination vs the ground, something like 18 degrees in our case), and then you decide how many panels you can fit or how many you want to put to offset how much your power bill.
The first problem is a not so simple multi factor equation because you switch to a time of use electric meter where the time of the day changes which billing range you're in, and each range has 5 tiers, the more you use the more expensive your Kwh becomes.
Then, to make things fun, you can try to compute how much you end up paying by Kwh for your solar electricity by factoring in how much you paid for the system over 30 years, and currently that per Kwh price for baseline usage (i.e. the first tier) was around 13¢ for me, or more than what I pay from PG&E. However, all remaining tiers were more than solar. Then, you could say that PG&E prices go up and baseline price will go up beyond 13¢. This is entirely correct but you have to factor this against investing the money you'd have put in panels at 4% and see what's better off.
Oh, and if you decide to generate your baseline use too, you don't want to overproduce because if you do, PG&E will not give you a negative bill: over the course of a year you can only offset your bill, not make it negative.
The last kicker is that you don't have to produce as much as you use to have a $0 bill because when you produce in May-Sept between noon and 6 (or something like that), that electricity is worth several times a kWh you use at night or during the winter. I found that producing 8,000Kwh can offset a 12,000Kwh yearly use.

Fitting solar panels on limited usable roof space

Anyway, now that this is out of the way, our house made going solar a bit more challenging because our roof is very jagged and most of our roof is not getting good sun exposure: a lot of it is east, which is not that desirable, whereas our west facing roof (better because it gets sun in the afternoon when electricity is worth more), gets significant shading from the trees on the creek side of our property.
So, we're left with our garage roofs pointing south-south-east unshaded, and a few pieces of our roof pointing due south, and that made things interesting because we had to fit panels on limited roof space, part of which was triangular shaped, making rectangular panels harder to fit, especially the bigger ones.
After getting my quote from the first vendor, it became clear that we'd have to worry about price per Kwh as much as Kwh per square footage of roof used.

Picking Vendors

This turned out to be much harder than I thought because they had different panels with different efficiency and pricing, which just added more variables to the already multiple variable equation of what to get. Also, all vendors gave you production estimates for the year, and end pricing after rebates. However most did not give Kwh/year / dollar (i.e. how many dollars a Kwh every year cost you), and only one gave the square footage used by their panels, and the more important Khw/year / sqft (i.e a panel array that produce 23kWh/Y per sqft of roof space used). While I know that those are not perfect numbers, they were the most useful in my comparison.
I wondered why the different vendors don't provide that useful data, but then I also realized that the 4 tech sales reps I talked to all said "oh, I never had anyone ask me that, let me find out for you" on multiple occasions. So it looks like most people just look at their spreadsheets and pie charts, find them pretty and sign based on that, or maybe based on price without knowing if they're getting the proper technology, or an install on paper that will even fit in practise. Admittedly my install case was probably a bit harder than some, but I got quotes that just didn't produce enough to be interesting and where the salesperson didn't measure what was really possible, so didn't offer it, or a quote where quite frankly the panels didn't fit (I went on the roof and measured), or a quote with thin film where the numbers showing thin film degradation over time had a 3X difference between a spec sheet and the sales pamphlet (-0.5% per year vs -1.5% per year, which is a huge difference). I ended up picking between the four vendors that had been pre-screened by work, and I'll list them below in the least desirable to most desirable order:
  • Rec Solar was last for two reasons: the salesman is the only one who never even climbed on my roof to measure exactly what surfaces were usable. He just eyed them and gave me a quote on paper without actually knowing if they would fit, what the design factor was, or if we could put more panels. Yet, I was supposed to sign, and then they'd come and see what they could really do for me. Yeah, right... Anyway, they did offer interesting and efficient smaller sanyo panels, but they were totally overpriced.
    Oh, the best part: one of the quotes was badly done and quoted a likely incorrect kWh/Y figure, giving a ridiculously high $4.3 per kWh/Y
  • Akeena had a good, knowledgeable technical salesman, but their system was very overpriced and while it's nice for having panels that connect like legos, requiring fewer attach points and wires, my roof did not allow for that many panels to be strung together and put in a single place. Out of the two quotes I got, the prices were quite high, and the panel efficiency was fairly poor too for monocrystaline (supposedly better) by being beat by much cheaper polycrystaline panels (evergreen 210) from solarcity.
  • Solarcity (First Solar reseller) came as a close second. The salesman really did his best to fit his system on our roof, address my concerns and my questions, and they threw in free monitoring of both production and home use (usually another $2k), as well as price matching. They gave me 3 fairly different options (at my request).
  • Cobalt Power (Sunpower reseller) was the last option I got, based entirely on Sunpower panels. To their credit that was the only option they needed because their panels were quite good.
The major problem I had comparing the vendors is that they all give you predicted production numbers that they call conservative, but have nothing to back them up. In other words, if they promise you a system that could make 9000kWh, but due to a difficult or poor install, or an over optimistic design factor they end up producing much less, that's pretty much too bad. Most of them would not back up their production numbers with any guarantee whatsoever. In the end, I got Cobalt to back up 85% of the production they promised, but if you think about it, a production 15% lower than what was hoped for is pretty big (of course, it's hard to give a 100% number since it also depends on weather).

Cobalt Power ended up winning because they quite frankly had the best panels. Not only did they have the best efficiency (yearly power per sqft of roof space) which was a crucial factor for us, their panels were a bit smaller so they fit better in confined spaces, and they were also quite competitively priced and not much more expensive than Solarcity.
Solarcity could have worked, but I didn't trust thin film too much since no one else used it, its degradation over time was just unclear and I read conflicting information about it. As for their evergreen polycrystaline solution, it was actually decent, but was 30% less efficient per amount of space as sunpower panels, while not being that much cheaper, so it was hard to go with that, even though I really liked the Solarcity rep too.

So there we go, I signed up with Cobalt, knowing that it was the best bang for the buck for the most efficient solution that we could fit on the good portions of the roof.
At the end, I did agonize between 27 225W panels or 30 panels as I was slightly worried that 30 panels just might produce more than what we used (at which point they become a clear monetary loss). In the end, we agreed that as long as 27 panels brought me in baseline, erasing all of baseline just wasn't necessary since it's a best a wash, and more likely a small loss over investing the money you didn't spend.

Install starts in a few weeks, I'll report back then. In the meantime, below was a rather time consuming to gather and compute comparison table that should be useful to other folks. If you're looking at this yourself, I heartily recommend you consider Sunpower first (Cobalt Power distributor in the bay), you can Email Mark Byington markb(at)cobaltpower.com for more details on a home visit and quote.

.

company panelsqtypanel sizepanel ft^2total panel ft^2W STCshading factorkWh/Ynet cost ($)price/ kWh/YkWh / Y / ft^2comment

.

cobaltSPR 2302731.4" x 61.4"13.38361.2662100.868463274163.2395131749970523.4263411393456highest power density

.

cobaltSPR 2153031.4" x 61.4"13.38401.464500.848539258823.0310340789319621.2730443447932

.

cobaltSPR 2253031.4" x 61.4"13.38401.467500.848909276653.105286788640722.1948181365222

.

cobaltSPR 2252731.4" x 61.4"13.38361.2660750.858114262163.2309588365787522.4602779161822

.

.

solarcitysanyo 2003531.4" x 61.4"13.38468.370000.889006331603.6819897845880519.2312620115311

.

solarcityevergreen 2103437.5" x 65"16.92575.2871400.889047286963.1718801812755615.7262550410235

.

solarcityFS -2759523.6" x 47.2"7.75736.2571250.879196270322.9395389299695512.4903225806452first solar thin film, note 95 panels, and lowest power density

.

.

akeenaandale ST1752432.2" x 62.6"1433642000.865293219484.1466087285093515.7529761904762

.

akeenaandale ST1753232.2" x 62.6"1444856000.816354285354.4908718917217514.1830357142857

.

.

REC solarsanyo 1952835.2" x 51.9"12.69355.325460?5854252464.312606764605416.4752898795452quote bad, numbers don't even add up

.

REC solarsanyo 1952435.2" x 51.9"12.69304.564680?5643215893.8258018784334618.5283687943262
2009/04/06 Solar Panel Install Done
π 2009-04-06 01:01 in Public, Solar
Actually the solar system has been up since Feb 26th, but I've been waiting on the install and hookup of the add on monitoring system. The monitoring isn't quite working reliably yet, but oh well the important part, power generation, is working fine and that's what matters :)

stack of 27 $1500 bills sitting outside :)

I chose the 225W panels as they were slightly cheaper but also looked nicer

this shows the rails that the panels are attached to

18 panels facing south east (not ideal) and 9 facing due south


the 6000W DC to 240V AC inverter

the PG&E guy coming in to install the time of use meter

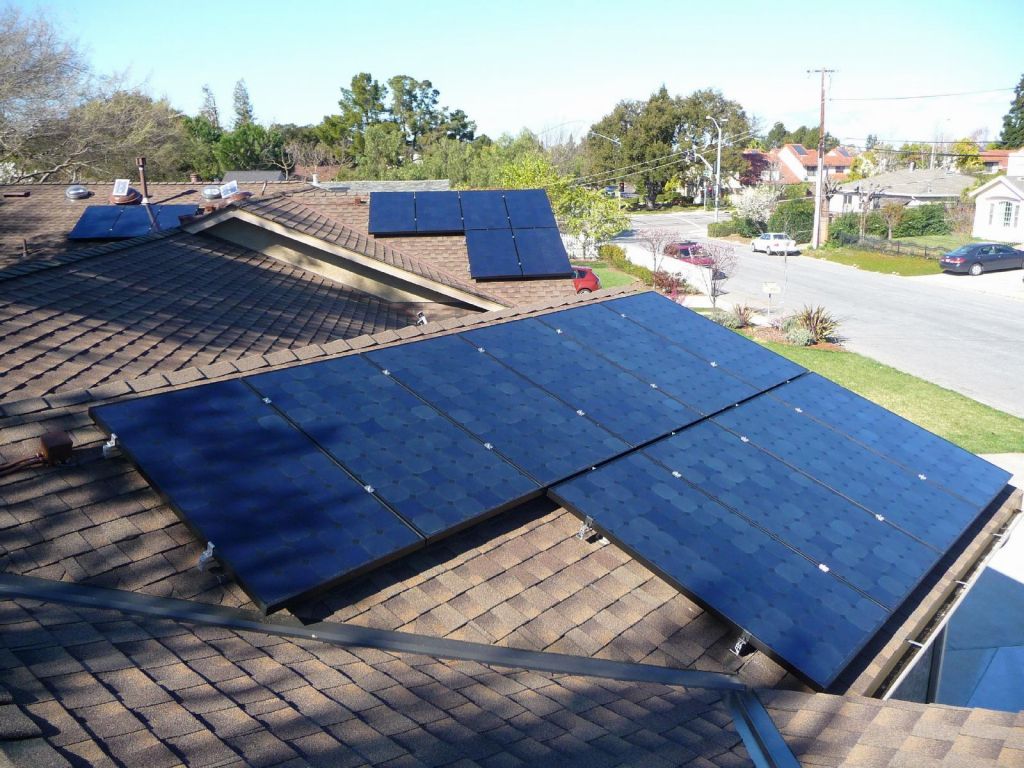
See more images for Solar Panel Install Done
2009/11/08 Brand One Powermeter, Solar and Power Monitoring with Cacti and Real Time PG&E Time of Use price calculation
π 2009-11-08 00:00 in Computers, Linuxha, Solar
Update: I have a much better solution (and meter), the ECM1240 from Brultech, read about it here.

Ok, the title is a mouthful, but that's why it's been about 6 months since I started and I have results to show for it only now.

My goals were to get:

  • a daily summary of power use per hour
  • have enough data to recreate a PG&E bill on a daily basis before we get it (to be able to predict whether we're using electricity in the right amount and at the right time before getting the bill).
  • more importantly, be able to drill a bill down to the day and the hour (we have data updates every 2mn) and see how much more power the house is using if the dishwasher is on, or the electric toaster oven.
  • get a real sense of how much our AC is running and how much it costs.
  • For this, while ordering the Solar Panels (aka PV system) from Cobalt Power, I asked for a monitoring system and the only one they found at the time that would allow monitoring of both the PV production and the PG&E Meter was a third party One Meter from One Brand Electronics.

    It looks like this:

    the meter that does gathering and resending to my monitoring server
    the meter that does gathering and resending to my monitoring server

    the probe gathering boxes (gets volts and amps)
    the probe gathering boxes (gets volts and amps)

    this shows the CTs that measure current from their induced magnetic field
    this shows the CTs that measure current from their induced magnetic field

    The voltage probes are simply connected to the lines and those are precise. Unfortunately, I don't care about voltage nearly as much as current sinc ethe voltage tends to be known and the current is what affects your bill.

    It's a reasonably easy solution to add to any setup during or after the fact, but the low points with the Brand Electronics One Meter solution are:

  • by design the current measured is inexact. I see current used on the PV inverter when it's not supposed to use much of anything, and of course I also see random small currents in either direction on the AC when it's off.
  • while the data gathered is good enough for general trends, longer term use has shown that it can be off by as much as 40Kwh/month on my PG&E Meter, which is a fair amount.
  • the One Meter interface is really bad. I'm a linux CLI guy, but it is bad. It is impossible to change its basic configuration like what it sends over telnet and at what interval without having its firmware reburnt by onebrand, but get this: you can't even change the IP address it'll talk to either without sending it back.
  • it has a serial interface for configuration that is quite poor and it'll dump old data you might have missed in a different format that what it sends over telnet to make your life harder.
  • it is a very slow microcontroller that is so slow that it takes over one minute to send 12 samples of data
  • it is of course unable to set its own time over ntp and is unaware of DST, so I just put mine on UTC and I fix things on the server side.
  • last, but not least, it will randomly corrupt itself and send totally bogus data points. Thankfully it however recovers at the next sample. I had to write fairly complex code to analyse the data samples, detect and throw away bad ones.
  • Ok, so are you sold yet? :)
    Well, it's not that bad now since I went through the effort of writing the code to deal with all this. So, if you were to get one, you'd be up and running pretty quickly if you can hack perl, the language I used for my magic script that does all the work (see the bottom of the page for source code).

    The above script took a fair amount of time to write since outside of working around quirks in the One Meter output, I wrote in the PG&E billing logic for California and it is able to output per hour per day production and use, as well as equivalency in dollars. Converting into dollars make sense since with TOU (time of use pricing) you can end up with days where your used more than you produced, but the end bill is still negative.

    This is a typical example of a summer day (July 8th picked at random):

    
    Hourly Differences
    00_:  0.9Kwh/$0.1 House|  0.0Kwh/$0.0 AC|  0.9Kwh/$0.1 HouseNoAC|  0.0Kwh/$0.0 PV|  0.9Kwh/$0.1 PG&E|
    01_:  0.9Kwh/$0.1 House|  0.0Kwh/$0.0 AC|  0.9Kwh/$0.1 HouseNoAC|  0.0Kwh/$0.0 PV|  0.9Kwh/$0.1 PG&E|
    02_:  1.0Kwh/$0.1 House|  0.0Kwh/$0.0 AC|  1.0Kwh/$0.1 HouseNoAC|  0.0Kwh/$0.0 PV|  1.0Kwh/$0.1 PG&E|
    03_:  0.9Kwh/$0.1 House|  0.0Kwh/$0.0 AC|  0.9Kwh/$0.1 HouseNoAC|  0.0Kwh/$0.0 PV|  0.9Kwh/$0.1 PG&E|
    04_:  0.9Kwh/$0.1 House|  0.0Kwh/$0.0 AC|  0.9Kwh/$0.1 HouseNoAC|  0.0Kwh/$0.0 PV|  0.9Kwh/$0.1 PG&E|
    05_:  0.9Kwh/$0.1 House|  0.0Kwh/$0.0 AC|  0.9Kwh/$0.1 HouseNoAC|  0.0Kwh/$0.0 PV|  0.9Kwh/$0.1 PG&E|
    06_:  0.9Kwh/$0.1 House|  0.0Kwh/$0.0 AC|  0.9Kwh/$0.1 HouseNoAC| -0.0Kwh/$0.0 PV|  0.8Kwh/$0.1 PG&E|
    07_:  0.9Kwh/$0.1 House|  0.0Kwh/$0.0 AC|  0.9Kwh/$0.1 HouseNoAC| -0.7Kwh/$0.1 PV|  0.1Kwh/$0.0 PG&E|
    08_:  0.9Kwh/$0.1 House|  0.0Kwh/$0.0 AC|  0.9Kwh/$0.1 HouseNoAC| -2.2Kwh/$0.2 PV| -1.3Kwh/$0.1 PG&E|
    09_:  0.9Kwh/$0.1 House|  0.0Kwh/$0.0 AC|  0.9Kwh/$0.1 HouseNoAC| -3.2Kwh/$0.3 PV| -2.3Kwh/$0.2 PG&E|
    10-:  0.8Kwh/$0.1 House|  0.0Kwh/$0.0 AC|  0.8Kwh/$0.1 HouseNoAC| -3.9Kwh/$0.6 PV| -3.1Kwh/$0.4 PG&E|
    11-:  0.9Kwh/$0.1 House|  0.0Kwh/$0.0 AC|  0.9Kwh/$0.1 HouseNoAC| -4.3Kwh/$0.6 PV| -3.4Kwh/$0.5 PG&E|
    12-:  0.8Kwh/$0.1 House|  0.0Kwh/$0.0 AC|  0.8Kwh/$0.1 HouseNoAC| -4.5Kwh/$0.6 PV| -3.6Kwh/$0.5 PG&E|
    13~:  0.9Kwh/$0.3 House|  0.0Kwh/$0.0 AC|  0.9Kwh/$0.2 HouseNoAC| -4.4Kwh/$1.3 PV| -3.5Kwh/$1.0 PG&E|
    14~:  0.8Kwh/$0.2 House|  0.0Kwh/$0.0 AC|  0.8Kwh/$0.2 HouseNoAC| -4.1Kwh/$1.2 PV| -3.2Kwh/$0.9 PG&E|
    15~:  0.9Kwh/$0.3 House|  0.0Kwh/$0.0 AC|  0.9Kwh/$0.3 HouseNoAC| -3.3Kwh/$1.0 PV| -2.4Kwh/$0.7 PG&E|
    16~:  0.9Kwh/$0.3 House|  0.0Kwh/$0.0 AC|  0.9Kwh/$0.3 HouseNoAC| -2.0Kwh/$0.6 PV| -1.1Kwh/$0.3 PG&E|
    17~:  0.9Kwh/$0.3 House|  0.0Kwh/$0.0 AC|  0.9Kwh/$0.3 HouseNoAC| -0.8Kwh/$0.2 PV|  0.1Kwh/$0.0 PG&E|
    18~:  0.9Kwh/$0.3 House|  0.0Kwh/$0.0 AC|  0.9Kwh/$0.3 HouseNoAC| -0.2Kwh/$0.1 PV|  0.7Kwh/$0.2 PG&E|
    19~:  1.0Kwh/$0.3 House|  0.0Kwh/$0.0 AC|  1.0Kwh/$0.3 HouseNoAC| -0.1Kwh/$0.0 PV|  0.9Kwh/$0.3 PG&E|
    20-:  1.0Kwh/$0.1 House|  0.0Kwh/$0.0 AC|  1.0Kwh/$0.1 HouseNoAC|  0.0Kwh/$0.0 PV|  1.0Kwh/$0.1 PG&E|
    21-:  1.1Kwh/$0.2 House|  0.0Kwh/$0.0 AC|  1.1Kwh/$0.2 HouseNoAC|  0.0Kwh/$0.0 PV|  1.1Kwh/$0.2 PG&E|
    22_:  1.0Kwh/$0.1 House|  0.0Kwh/$0.0 AC|  1.0Kwh/$0.1 HouseNoAC|  0.0Kwh/$0.0 PV|  1.1Kwh/$0.1 PG&E|
    23_:  0.9Kwh/$0.1 House|  0.0Kwh/$0.0 AC|  0.9Kwh/$0.1 HouseNoAC|  0.0Kwh/$0.0 PV|  0.9Kwh/$0.1 PG&E|
    ----------------------------------------------------------------------------------------------------
    Wed: 22.6Kwh/ $3.4House|  0.1Kwh/ $0.0AC| 22.5Kwh/ $3.4HouseNoAC| 34.7Kwh/-$6.7PV|-12.1Kwh/-$3.3PG&E|
    
    Split per rate:
    $.08 11.0Kwh/$0.93House|  0.0Kwh/$0.00AC| 10.9Kwh/$0.92HouseNoAC| -6.2Kwh/$0.52PV|  4.9Kwh/$0.41PG&E|
    $.14  4.6Kwh/$0.67House|  0.0Kwh/$0.00AC|  4.6Kwh/$0.66HouseNoAC|-12.7Kwh/$1.83PV| -8.0Kwh/$1.16PG&E|
    $.29  6.2Kwh/$1.83House|  0.0Kwh/$0.00AC|  6.2Kwh/$1.82HouseNoAC|-14.8Kwh/$4.35PV| -8.6Kwh/$2.52PG&E|
    
    Solar panels produced  34.7Kwh during 12.10h, between 06:46:28 and 18:50:28
    

    Yellow shows partial peak rates, where it's good to have the meter run backwards, and red for peak rates when it's even better. Unfortunately the solar panels are facing south east and south instead of south west where they would produce more when electricity is worth more.

    That is a more interesting example in September showing that despite having used more electricity in a day than what was produced, the daily bill was still negative thanks to the time of use magic, even it our case where we only get partial benefit from TOU due to the sub optimal south east angle for some of our panels:

    
    Hourly Differences
    00_:  0.9Kwh/$0.1 House|  0.0Kwh/$0.0 AC|  0.9Kwh/$0.1 HouseNoAC|  0.0Kwh/$0.0 PV|  0.9Kwh/$0.1 PG&E|
    01_:  1.0Kwh/$0.1 House|  0.0Kwh/$0.0 AC|  1.0Kwh/$0.1 HouseNoAC|  0.0Kwh/$0.0 PV|  1.0Kwh/$0.1 PG&E|
    02_:  0.9Kwh/$0.1 House|  0.0Kwh/$0.0 AC|  0.9Kwh/$0.1 HouseNoAC|  0.0Kwh/$0.0 PV|  0.9Kwh/$0.1 PG&E|
    03_:  0.9Kwh/$0.1 House|  0.0Kwh/$0.0 AC|  0.9Kwh/$0.1 HouseNoAC|  0.0Kwh/$0.0 PV|  0.9Kwh/$0.1 PG&E|
    04_:  0.9Kwh/$0.1 House|  0.0Kwh/$0.0 AC|  0.9Kwh/$0.1 HouseNoAC|  0.0Kwh/$0.0 PV|  0.9Kwh/$0.1 PG&E|
    05_:  0.9Kwh/$0.1 House|  0.0Kwh/$0.0 AC|  0.9Kwh/$0.1 HouseNoAC|  0.0Kwh/$0.0 PV|  0.9Kwh/$0.1 PG&E|
    06_:  0.9Kwh/$0.1 House|  0.0Kwh/$0.0 AC|  0.9Kwh/$0.1 HouseNoAC|  0.0Kwh/$0.0 PV|  0.9Kwh/$0.1 PG&E|
    07_:  0.9Kwh/$0.1 House|  0.0Kwh/$0.0 AC|  0.9Kwh/$0.1 HouseNoAC| -0.1Kwh/$0.0 PV|  0.8Kwh/$0.1 PG&E|
    08_:  0.9Kwh/$0.1 House|  0.0Kwh/$0.0 AC|  0.9Kwh/$0.1 HouseNoAC| -1.5Kwh/$0.1 PV| -0.7Kwh/$0.1 PG&E|
    09_:  0.8Kwh/$0.1 House|  0.0Kwh/$0.0 AC|  0.8Kwh/$0.1 HouseNoAC| -2.8Kwh/$0.2 PV| -1.9Kwh/$0.2 PG&E|
    10-:  0.9Kwh/$0.1 House|  0.0Kwh/$0.0 AC|  0.8Kwh/$0.1 HouseNoAC| -3.5Kwh/$0.5 PV| -2.6Kwh/$0.4 PG&E|
    11-:  0.8Kwh/$0.1 House|  0.0Kwh/$0.0 AC|  0.8Kwh/$0.1 HouseNoAC| -3.9Kwh/$0.6 PV| -3.1Kwh/$0.4 PG&E|
    12-:  0.8Kwh/$0.1 House|  0.0Kwh/$0.0 AC|  0.8Kwh/$0.1 HouseNoAC| -4.1Kwh/$0.6 PV| -3.2Kwh/$0.5 PG&E|
    13~:  0.8Kwh/$0.2 House|  0.0Kwh/$0.0 AC|  0.8Kwh/$0.2 HouseNoAC| -4.0Kwh/$1.2 PV| -3.2Kwh/$0.9 PG&E|
    14~:  0.8Kwh/$0.2 House|  0.0Kwh/$0.0 AC|  0.8Kwh/$0.2 HouseNoAC| -3.6Kwh/$1.0 PV| -2.8Kwh/$0.8 PG&E|
    15~:  0.9Kwh/$0.3 House|  0.0Kwh/$0.0 AC|  0.8Kwh/$0.2 HouseNoAC| -2.2Kwh/$0.6 PV| -1.3Kwh/$0.4 PG&E|
    16~:  0.9Kwh/$0.3 House|  0.0Kwh/$0.0 AC|  0.9Kwh/$0.3 HouseNoAC| -1.0Kwh/$0.3 PV| -0.1Kwh/$0.0 PG&E|
    17~:  0.9Kwh/$0.3 House|  0.0Kwh/$0.0 AC|  0.9Kwh/$0.3 HouseNoAC| -0.1Kwh/$0.0 PV|  0.8Kwh/$0.2 PG&E|
    18~:  0.9Kwh/$0.3 House|  0.0Kwh/$0.0 AC|  0.9Kwh/$0.3 HouseNoAC| -0.1Kwh/$0.0 PV|  0.8Kwh/$0.2 PG&E|
    19~:  0.9Kwh/$0.3 House|  0.0Kwh/$0.0 AC|  0.9Kwh/$0.3 HouseNoAC|  0.0Kwh/$0.0 PV|  0.9Kwh/$0.3 PG&E|
    20-:  0.9Kwh/$0.1 House|  0.0Kwh/$0.0 AC|  0.9Kwh/$0.1 HouseNoAC|  0.0Kwh/$0.0 PV|  0.9Kwh/$0.1 PG&E|
    21-:  2.6Kwh/$0.4 House|  1.1Kwh/$0.2 AC|  1.5Kwh/$0.2 HouseNoAC|  0.0Kwh/$0.0 PV|  2.7Kwh/$0.4 PG&E|
    22_:  3.2Kwh/$0.3 House|  1.1Kwh/$0.1 AC|  2.0Kwh/$0.2 HouseNoAC|  0.0Kwh/$0.0 PV|  3.2Kwh/$0.3 PG&E|
    23_:  3.8Kwh/$0.3 House|  1.8Kwh/$0.2 AC|  2.0Kwh/$0.2 HouseNoAC|  0.0Kwh/$0.0 PV|  3.8Kwh/$0.3 PG&E|
    ----------------------------------------------------------------------------------------------------
    Thu: 29.0Kwh/ $4.0House|  4.4Kwh/ $0.4AC| 24.7Kwh/ $3.6HouseNoAC| 27.6Kwh/-$5.2PV|  1.5Kwh/-$1.2PG&E|
    
    Split per rate:
    $.08 15.8Kwh/$1.34House|  3.0Kwh/$0.25AC| 12.9Kwh/$1.09HouseNoAC| -4.4Kwh/$0.37PV| 11.5Kwh/$0.97PG&E|
    $.14  6.0Kwh/$0.87House|  1.1Kwh/$0.17AC|  4.9Kwh/$0.70HouseNoAC|-11.5Kwh/$1.66PV| -5.4Kwh/$0.78PG&E|
    $.29  6.1Kwh/$1.79House|  0.0Kwh/$0.00AC|  6.1Kwh/$1.78HouseNoAC|-10.9Kwh/$3.19PV| -4.8Kwh/$1.40PG&E|
    
    Solar panels produced  27.6Kwh during 10.20h, between 07:34:28 and 17:48:28
    

    Now, a per hour text output is useful to see how we did on a given day, but it does not let you see your power usage in the last 10mn after you turned something big on or off, or how all of last week looked, or see a month's trend at a glance.

    This is where cacti comes in. I spent a fair amount of time looking for a graphing solution that would keep all my data and let me zoom on any portions I wish. Quite frankly, the fancy widget that google uses in google finance would have been what I was really hoping for, but baring that, cacti came like a reasonable alternative.

    So, I came up with a compound graph that looked reasonable, and the option to see all the graph items separately.

    So since this is about solar panels, one of my questions to Cobalt Power was why my system was spec'ed for 5Kwh at peak and why I was typically seeing 4.5-4.7Kwh at best. The reason is that 2/3rd of the panels are pointing south-south-east and the remaining 3rd is pointing due south.
    What this means is that our system doesn't actually peak at one time and then drop off. The graph clear shows that the PV production takes longer to peak and then stays at that lower peak a bit longer before dropping off more sharply. So, the production at the end of the day is still the same, but just with a slightly longer and slightly lower peak. Too bad the peak is on the morning side as opposed to the afternoon side when the electricity is worth more.
    You'll also notice the sharp start which is when the sun goes high enough to reach the roof over the neighbours' houses across the street. You'll also notice the jigsaw drop on the way down as the sun starts to get hidden behind some branches in the high trees blocking our west view.

    This graph and the graphs below are selected in zoom mode, so you can use the mouse cursor to draw a rectangle on a time region and the graph will refresh on the time slice you selected.


    Below is a closeup of all the colors showing AC working hard in bursts while the black PG&E meter line goes from sometimes negative to always positive the green area of solar panel energy offset goes down to 0. Blue then shows the basic house energy usage with the red peaks on top showing AC tripling the house electricity use when it's running.


    In other words: the red line is the AC use, the blue is the rest of the house use, red line goes on top of house use gives the red area which is total house use. You then remove green which is production from the solar panels and you end up with the black line which is what the PG&E meter actually sees. Confused yet? :)

    Here's a typical day without AC use since we weren't home:


    Here's a very warm day with AC (keep in mind that you can zoom in by selecting a time slice with the mouse):


    and a glance at just AC use during a few hot days in July:


    Here is a link to an historical view of this graph at multiple time sample levels. Try the zoom function (magnifying mirror next to the graph) on the yearly graph at the bottom and you'll be able to zoom on random time in the past.

    Another view is each probe graphed separately for a less cluttered view. Note that the AC view is pretty useless right now as it's only showing noise picked up by the coils, but if you click on it, you'll get the multiple timerange view as above and can view more interesting months, like the July zoom above.

    What else?
    Well, I had written some somewhat complex code to actually keep up of production for each tier and find out if I went into tier 2 to 5 (which pay or cost more per unit of energy), but because the One Meter gives me somewhat inaccurate readings, especially on the PG&E side, the numbers were just too far off to compute a bill that was close enough to the actual bill I was getting. So, I unfortunately had to give that part up.
    It would otherwise have been nice to know in advance if my use or production for a given tier was going to exceed tier 1 and possibly adjust electricity use accordingly, but I'll need a more accurate measuring device than the One Brand one.

    All this ended up being a fair amount of work, which with not that much extra work could have been a service that all solar companies sell. I think a few do, but I'm not sure if it's as complete as what I did, or if it is, please let me know so that I can compare with their work.

    Anyway, if it's useful to you, here's the parsebrandpower script. Please note that if you were planning on taking it and selling service based on my work, it is protected by the GPL 3 copyright which you must understand and apply if you are going to use it. I also request that you contact me and let me know if you're going to use the code.
    For more details on cacti integration, see my Gatewaying 1-wire, XPL (Oregon Scientify Weather), Brultech ECM1240 Power Data, and Brand OneMeter Data to cacti page.

    2010/02/14 Daily Power and Solar Stats
    π 2010-02-14 01:01 in Computers, Linuxha, Solar
    It's not quite a year yet, but I've recently worked on daily stats for our solar panels. If you go to the Solar and Power Monitoring post, you get all the stats that are gathered every few minutes.
    I was however missing daily stats showing for each day what time production started, what time it stopped (depending on dailight savings time of course), how many hours of sun we got. I also added a repeat of how many Kwh were produced that day.

    Here are the resulting graphs (as a reminder you can zoom in by selecting a rectangle with the first mouse button and zoom out with the second button).

    The good news from that data is that even the worst day, we made at least 3Kwh, which is what some small apartments use in a day. The average at the end of a year cycle should be around 24Kwh/day, which is 80% of what we end up using and less that what we'll end up paying once you figure out time of use offsets (i.e. the average electricity we make is worth more than the electricity we use).

    Below is a graph with production start and end (hour the sun starts hitting the panels and when it sets past the roof). Note the one hour jump on Nov 1st because of the daily savings change.


    Production hours:


    Production Kwh:


    Last, but not least this page lets you get all the daily starts (note, you need to change the top preset to 3, 6, or 12 months to get useful data, last day doesn't show anything).

    See more images for Daily Power and Solar Stats
    2010/03/11 One Year Of Solar Panels
    π 2010-03-11 01:01 in Computers, Linuxha, Solar
    Today is the one year anniversary of the Solar Panels Turnup, so I thought I'd gather a few stats to see how they did (unfortunately the full house monitoring system only became active more than 2 months later, so I don't have full stats).

  • Cobalt Power Estimated the panels yearly production at 8114Kwh for a year. I was a bit apprehensive during the quotes because of our weirdly shaped roof and shading issues from nearby trees, but in the end we got exactly 8700Kwh a year later, or almost a 600Kwh production beyond the estimate. Great!
  • Cobalt Power estimated our federal tax credit to $11,235 (the CA tax rebate is directly taken off the initial bill). I just got my taxes done and our tax credit was $11,746. this made the panels around $500 cheaper than quoted. Great again! :)
  • According to PG&E, we used around 1600Kwh since last year (i.e. we used about 1.5 months' worth of electricity), but due to the time of use credits (summer daytime electricity that we mostly produce is worth more than night and winter electricity), we actually got a $40 credit for the year, so we won't owe them anything outside of the monthly connection charge ($10, which is much cheaper than batteries and being off-grid). This year the $40 is lost but next year, they'll actually owe us whatever credit we get (i.e. we get a check back).
  • At this rate, we should break even in 5 years.
  • So in a nutshell, the system performed great so far. Cobalt Power definitely underpromised and over delivered and we're apparently done paying electricity bills from now on.

    Here are the not quite yearly graphs (as a reminder you can zoom in by selecting a rectangle with the first mouse button and zoom out with the second button).

    As a slight repost, below is a graph with production start and end (hour the sun starts hitting the panels and when it sets past the roof). Note the one hour jump on Nov 1st because of the daily savings change.


    Production hours:


    Production Kwh (nice to see that March is getting a lot more sun):


    Last, but not least this page lets you get all the daily starts (note, you need to change the top preset to 3, 6, or 12 months to get useful data, last day doesn't show anything).

    See more images for One Year Of Solar Panels
    2010/05/12 One Year Of Solar Stats
    π 2010-05-12 01:01 in Computers, Solar
    It's been one year since I started graphing power and solar usage with the Brand One Powermeter. To be honest, I've been very underwhelmed with that device and would not recommend it to others, but I was still able to get stats, even if they aren't quite correct.

    What's wrong with the brand one and its CTs is:

  • it randomly corrupts itself and sends me totally bad data that I have to filter out in software (know bug, owner says he filters it out too instead of fixing the broken hardware)
  • the overall software is very sad, not just the 2010 bug which is not a bug but plain lazy programming (2009 turns into 200: because ':' comes after '9' in the ASCII table). You should see the limited serial programing interface and error handling or lack thereof.
  • the fact that the unit is so slow that it can only upload once every 2mn and it totally locks up while doing so
  • I can't change its IP or any of its settings without sending it back to the owner and waiting 2 weeks or more.
  • My last support round trip to fix a misprogramming took almost 2 months to get it back fixed with weeks at a time where I got no Email answers.
  • Anyway, despite its flaws and confirmed incorrect measurements that are off by more than 2% and not in a consistent fashion (I tried to derive an error per day or kwh, but it was all over the map, from 2kwh short per day to overcounting during the winter. I think part of the problem is that the CTs are too big and pick up too much noise in the case of the solar panel probe.

    Anyway, the PV system had its own counter and reported 8566Kwh for that period of time while the powermeter measured 8260Kwh (a bit over 5% off).

    This graph and the graphs below are selected in zoom mode, so you can use the mouse cursor to draw a rectangle on a time region and the graph will refresh on the time slice you selected. Note that you can also zoom out by clicking the graph with the right button:

    House Power without AC, you can guess which day was our wedding day :)


    House Power


    AC doesn't look like much, but it still comes in handy 6 months a year:


    Photovoltaic production looks pretty good, even during the better winter days:


    Also, the daily production start and end (hour the sun starts hitting the panels and when it sets past the roof while the end hour can be a bit early because of trees on the west of our roof). Note the one hour jump on Nov 1st and March 6th because of the daily savings change:


    And the interesting part is the PG&E Meter. 0.25Kwh average is 2170Kwh/year, but due to time of use our bill is actually slightly negative:


    Anyway, even if the scientist in me is quite bothered by the inaccuracy of the Brand One Powermeter (the data being over 5% off is just no good), it's still good enough for nice trend graphs and seeing the results one year later.

    See more images for One Year Of Solar Stats
    2010/06/18 Powering UPSes with Marine or AGM batteries
    π 2010-06-18 00:00 in Computers, Electronics, Linuxha, Solar
    So, isn't it a bit ironic that if I have solar panels that power my entire house and then some during the day, if PG&E power goes off, my inverter has no choice but to shut off too, likely both because it uses PG&E as a phase offset source, and because it would likely be bad to feed power on a down PG&E line (or at least would make it harder for PG&E to diagnose, not counting the fact that the power grid acts as a regulator in case there is too much or not enough power).

    Anyway, I wanted to have power a bit longer than 10mn when PG&E power went out, so I looked into UPS solutions while powering from a Marine or a AGM (Absorbed Glass Material) battery, both being better options than a car battery (car batteries are not meant to be deep cycled or use for extended periods of time and they do put out hydrogen when you charge them, which is undesireable inside a house).

    Interesting bits I found out:

  • This page http://www.type2.com/library/electrip/battbas.htm has decent battery info, and this one gives a bit more about AGM batteries http://www.windsun.com/Batteries/Battery_FAQ.htm . Yet, even marine or AGM batteries are not meant to be discharged at high rate. If you do, they may not even put out half their rated capacity.
  • UPSes aren't meant to be used as inverters for long time power off situations. Some will actually use more than one battery (increases voltage, decreases amps, which is good for lowering draw, but makes it a pain when you need multiple big matching marine batteries).
  • Drawing 1400VA from an APC UPS at 24V is about 60A! That's about 3-4 times what the average copper wire going to your house outlet is supposed to carry. These pages: http://en.wikipedia.org/wiki/American_wire_gauge and http://www.powerstream.com/Wire_Size.htm give some guidelines, but long story short, you need a very thick wire to carry that many amps over more than 10cm without heating up your wires (never good) and wasting a lot of power through resistive loss.
    I first quadrupled up my initial wire but then realized that it only took me from 18 gauge to 12 gauge, which was a bit low, so doubled that up with a cable I cut off from a jumpstart cable (that one was plenty thick, it was more an issue to solder it to the rest due to how massive it was and how underpowered my soldering iron was for the job).
  • In the end, I got a couple of mostly matching AGM batteries and went ahead with those for my 24V APC 1400 SmartUPS. I know my runtime wouldn't be fantastic but good enough considering (at least until I can find another free marine battery :) ).

    At 400W of actual use, that was 40% of the load for the APC 1400 inverter and a self test estimated that I would get about 1H of runtime, which gave 16Ah usable for my AGM batteries instead of about 55Ah at a lower draw (when new, and they were not new). It's a bit disappointing on one side, but on the other side, 1H of runtime for my computer gear ain't too bad, especially for AGM batteries that cost $20 a pieces (cheaper than the stock 7Ah batteries).


    first I quadrupled the wire.
    first I quadrupled the wire.

    this is a big ass gauge jumper cable
    this is a big ass gauge jumper cable

    what it looks like connected
    what it looks like connected


    Anyway, even if this isn't quite the runtime I was hoping for, and it seems hard to find any UPS with a good VA rating by using a single 12V battery (not too surprising due to the amp problem I pointed out), this is still pretty cool.

    2010/08/13 Fine grained house-wide power monitoring with Brultech ECM1240, ecmread.py (with net metering support), and graphing with cacti
    π 2010-08-13 00:00 in Computers, Linuxha, Solar

    Introduction

    Until recently, I had a Brand One Powermeter to measure PG&E Meter, PV system and my AC. It was bulky, unreliable, and impossible to reprogram. In other words, it was a poor and expensive solution. That said, I still got some data and reasonable graphs from it as per this earlier blog post.

    But let's be honest, I really didn't like that monitor and wanted to ditch it. After some research, the ECM1240 is the best feature/cost ratio power monitoring device I found (as of 2010). As of 2019, the ECM1240 is now obsolete and replaced by the Greeneye, see below:

    _Note, there seems to be a better monitor now, the Greeneye._ You may want to have a look at Brultech Greeneye.

    Why is it better than the alternatives?

  • you can monitor 7 (!) channels plus voltage for less than $200
  • you can use multiple devices to monitor more than 7 channels (I monitor 20 in my panel)
  • it comes with multiple CTs to chose from, from highly accurate high current split CTs or TTs to small quarter sized CTs that are appropriate for monitoring all your smaller loads behind each of your circuit breakers
  • you can monitor let's say 6 circuit breakers as one channel (like 'all lights').
  • the data gatherer can be connected to your computer via serial port (what I used), ethernet, or wireless (for comparison the TED device, aside from being a single channel device, can only communicate over your power lines, which is unreliable and almost a guaranteed disaster if you use X10 or insteon home automation).
  • the owner is helpful is responsive to intelligent questions
  • while the software is meant for windows, data can be gathered on linux or any OS that can run python (i.e. just about anything) thanks to ecmread.py provided in this page.
  • Here's what it looks like:

    the whole system
    the whole system

    I calibrated the TTs vs the split 60CTs and the small CT-40s by comparing measurements of the same load
    I calibrated the TTs vs the split 60CTs and the small CT-40s by comparing measurements of the same load

    the 2 white boxes are the ECMs1240s, but I also have my older and bigger brand one power meters in there
    the 2 white boxes are the ECMs1240s, but I also have my older and bigger brand one power meters in there

    the small donut CT-40s are great, they take no room at all
    the small donut CT-40s are great, they take no room at all

    After getting this installed, I was able to get data on linux after I got a working but incomplete (for me) ecmread.py from prior authors, Brian Jackson, Kelvin Kakugawa, and Amit Snyderman. I modified it to support net metering and show high precision data as required by proper per second graphing in cacti.

    Code

  • Here is a link to my improved ecmread.py.
  • And is here my ecmread logfile to cacti/rrdtool converter.
  • My init script
  • My script to add labels to each channel
  • My generic page with logfile to cacti converters.
  • Gratuitous Graphs :)

    Ok, first you can find all the graphs here: all regular owfs derived graphs.
    And here are the interesting composite graphs.

    So, US houses come with 2 120V phases. Now, if you wanted 100% exact wattage measurements, you'd have to measure the voltage on each and every circuit breaker you measure, but in reality measuring each phase is close enough.
    In real life, measuring amps on one phase with voltage from another phase will only give you about a 1-2% error at worst, so it's not a lot to agonize about. In my setup I tried to measure phase 2 loads on my ECM that's plugged into phase 2 power, but wasn't fully able to do it, and it's not meaningful when you measure 240V loads anyway.

    This is what the phases look like, as the graph shows phase 1 typically gets more power than phase 2 for me, but depending on the load in my street and my house, they sometimes become close or equal:

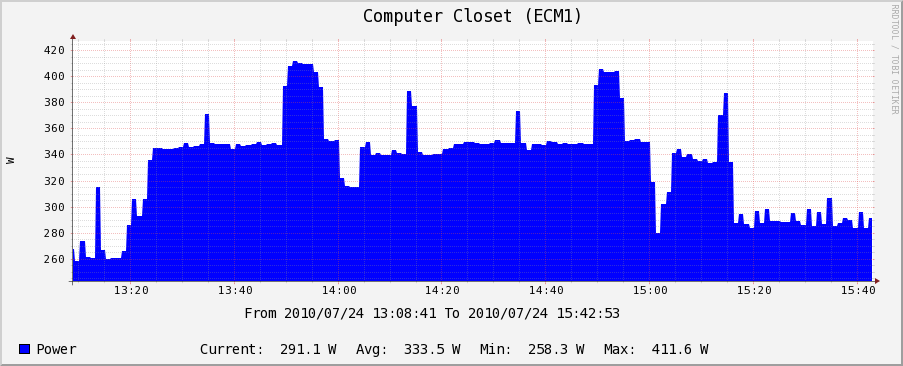
    Of course, I have a lot of single interesting graphs. Can you tell when my disk to disk backup completed? :)

    More importantly, and worryingly, compiling the same kernel took 30mn and 20W on my dual core duo laptop:

    While compiling the same kernel on my dual Xeon P4 server took 2H and 80W-ish:

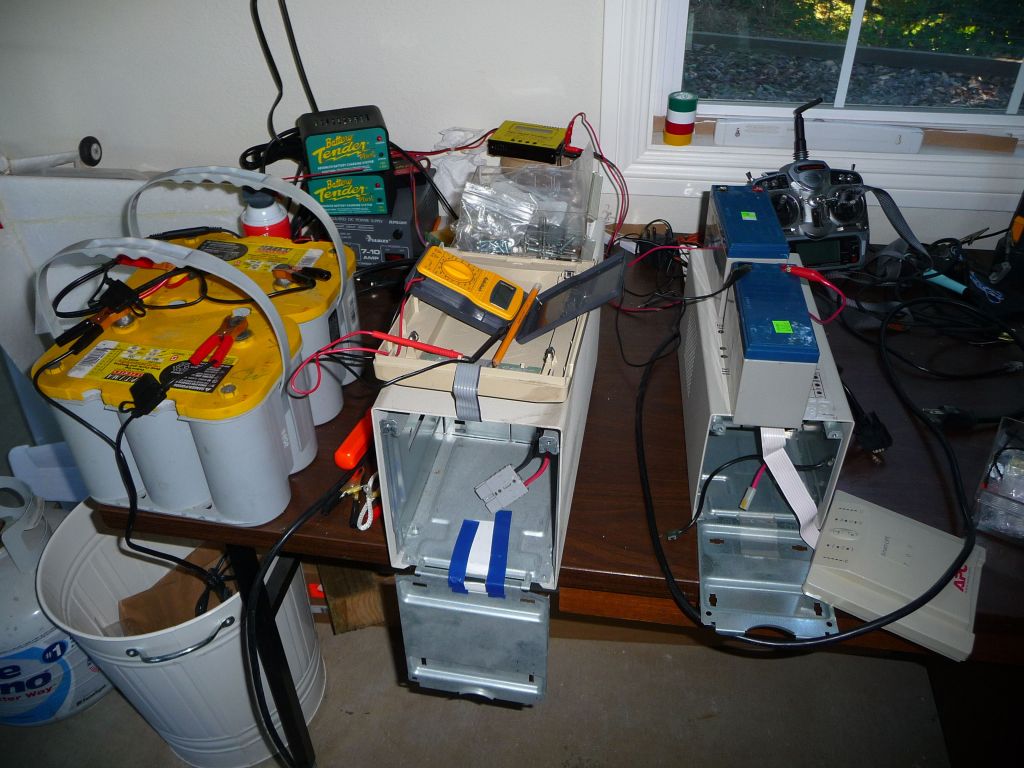
    Another interesting graph was charging a 12V marine battery for my UPS:

    Thanks to this graph, I was able to find that my TV and speakers took 30W when off. I got a smart power strip that turns them off totally and saved about 30W off my base load:

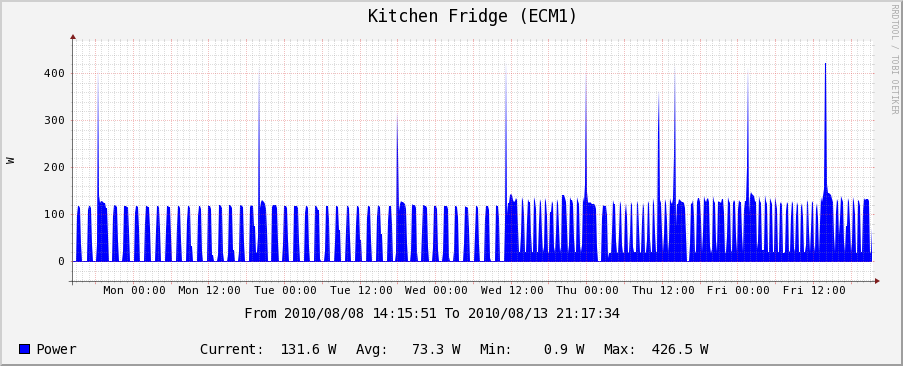
    Ever wonder how much power your fridge is really using?

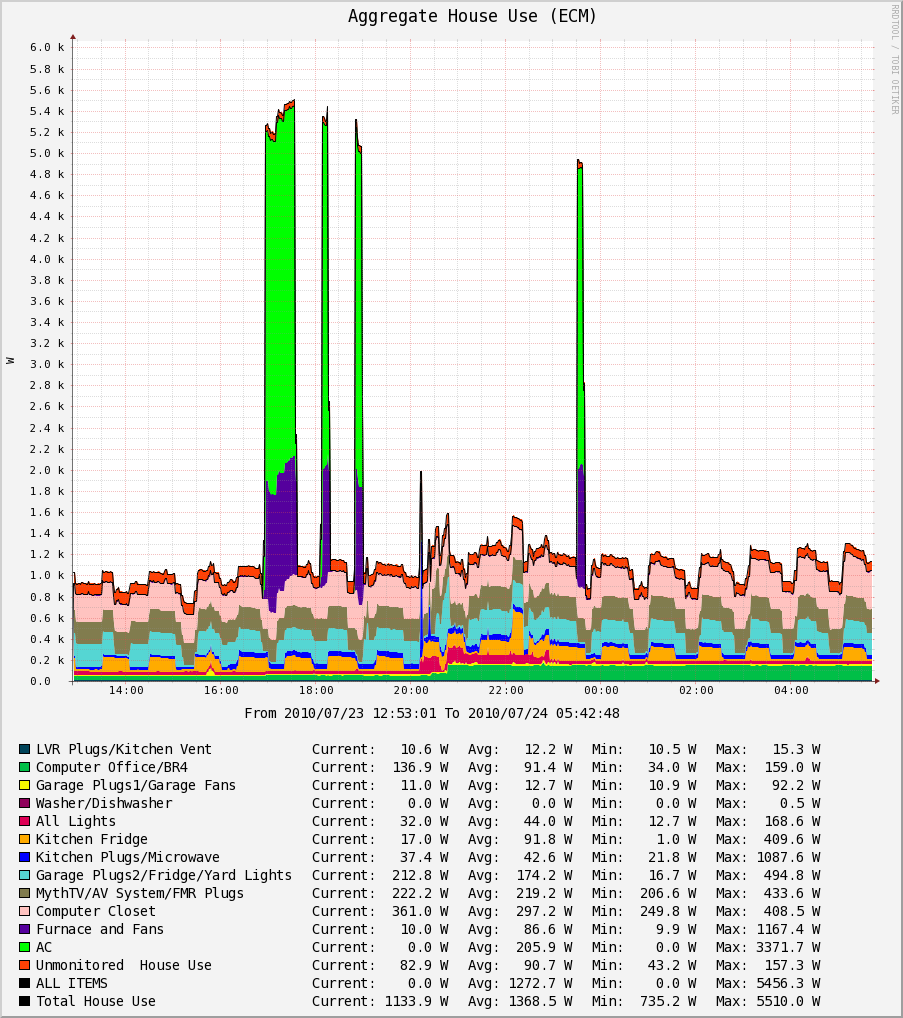
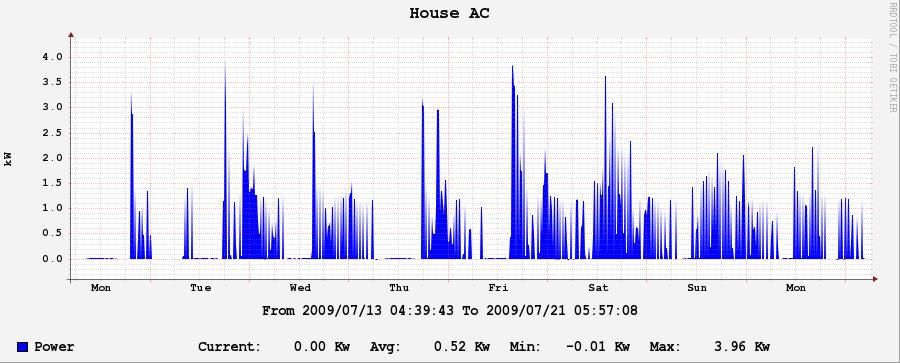
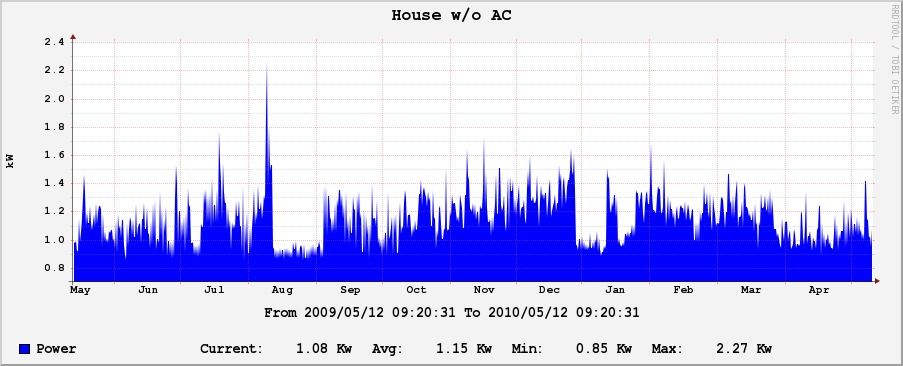
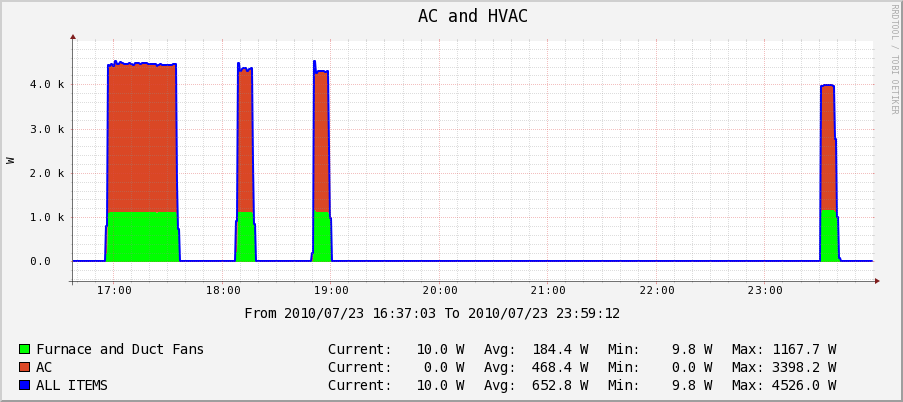
    So, how much power does AC use? Well, not only 3500W for AC, but another 1000W for the whole house fans:

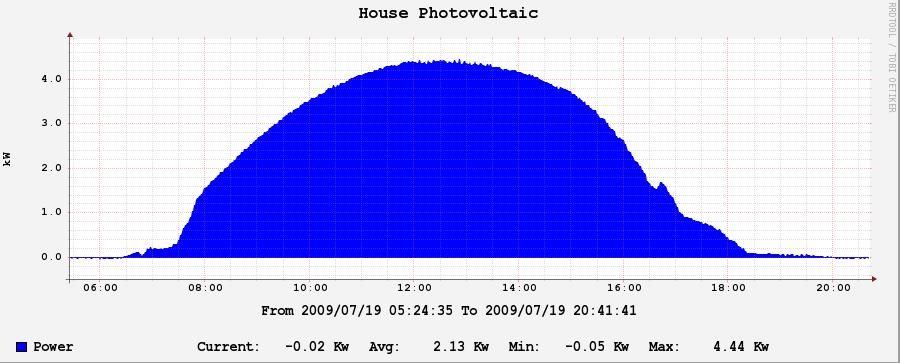
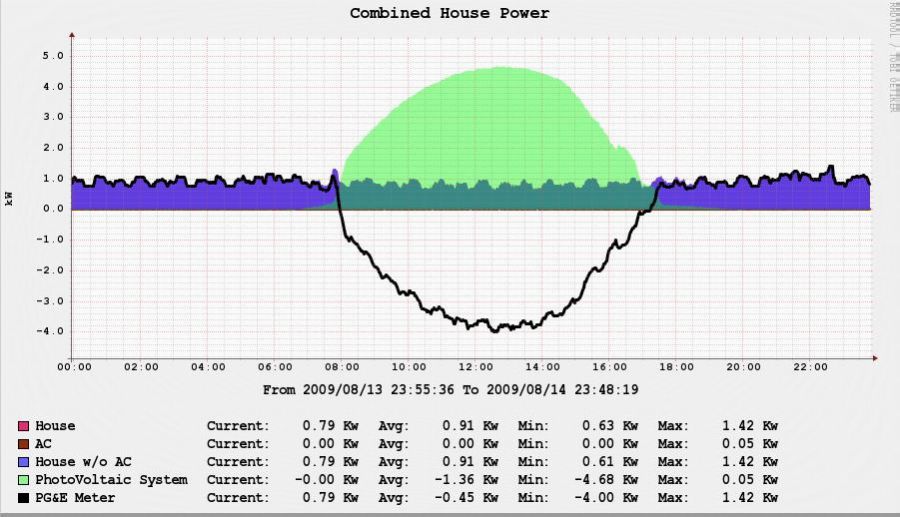
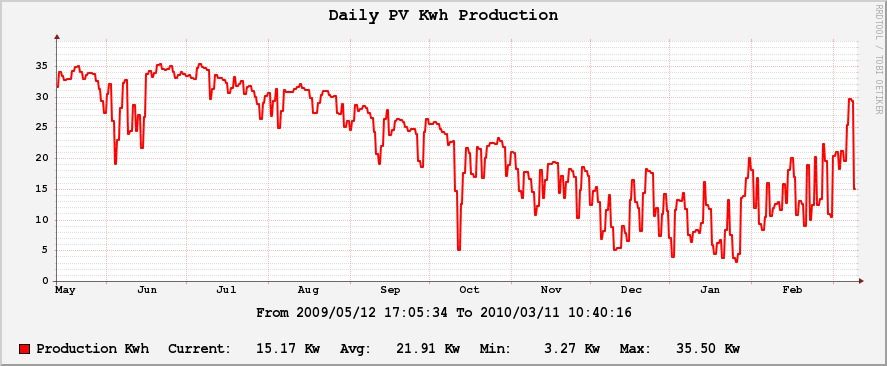
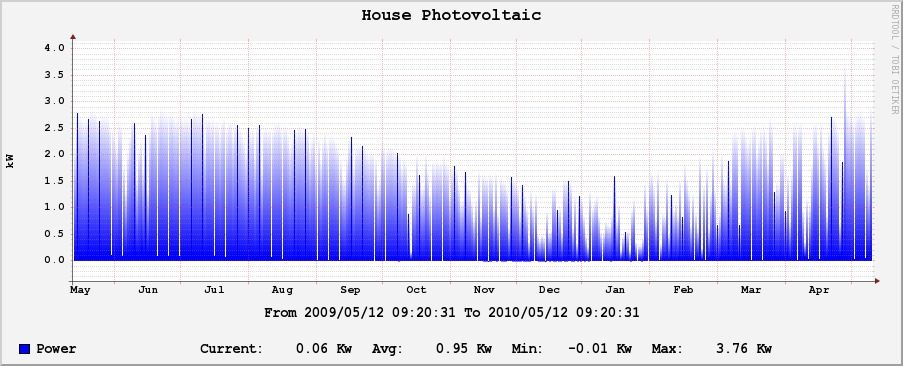
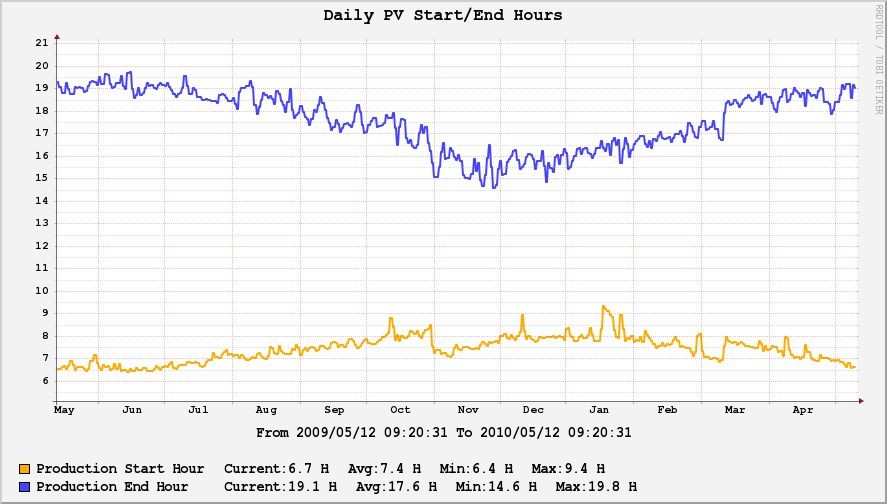
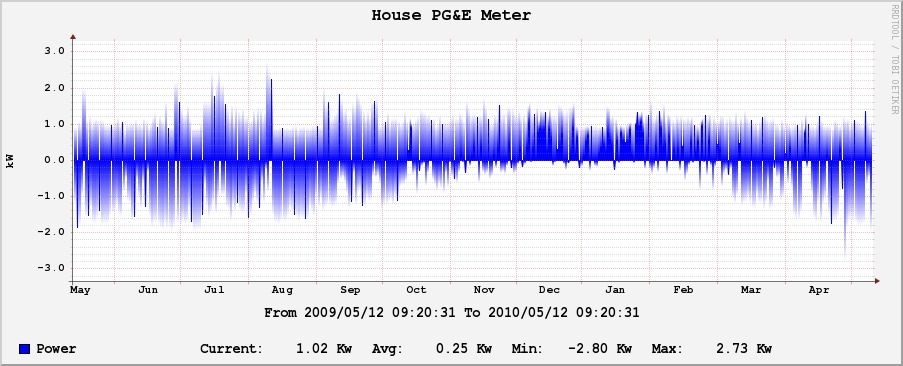
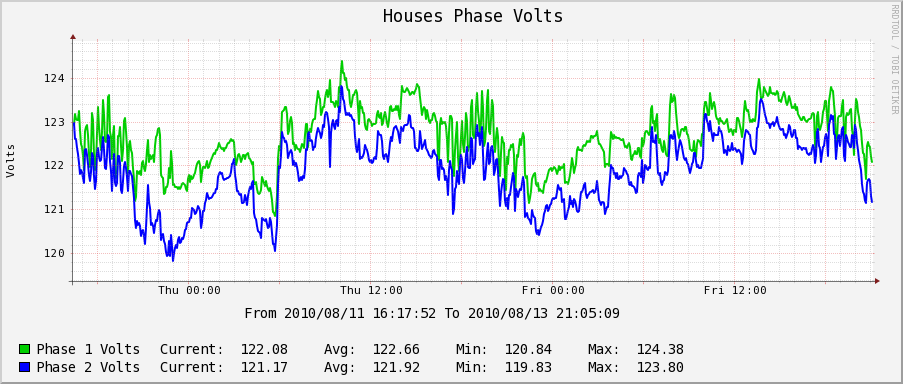
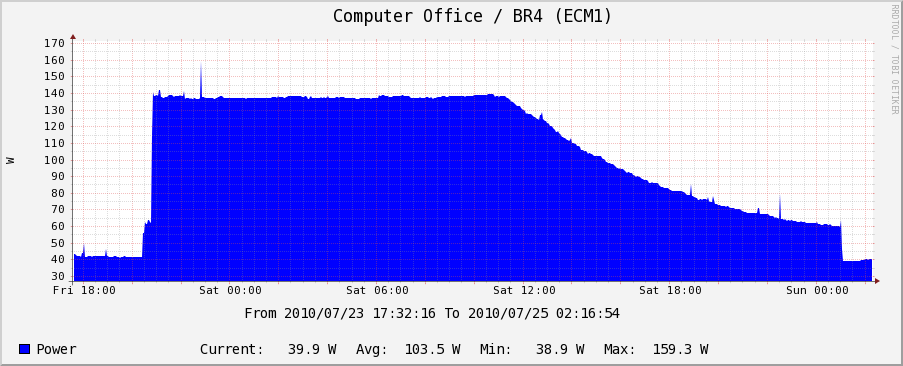
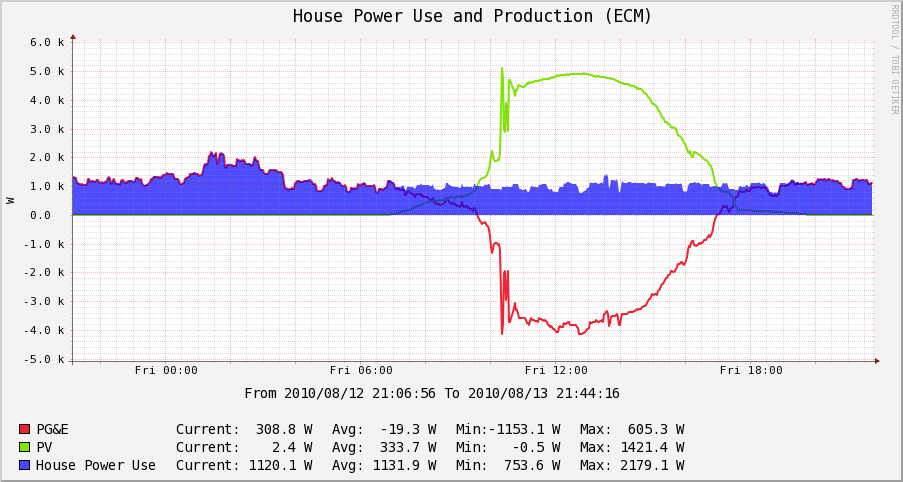
    A cool graph showing House Power Use (calculated) from PG&E meter and PV production probe:

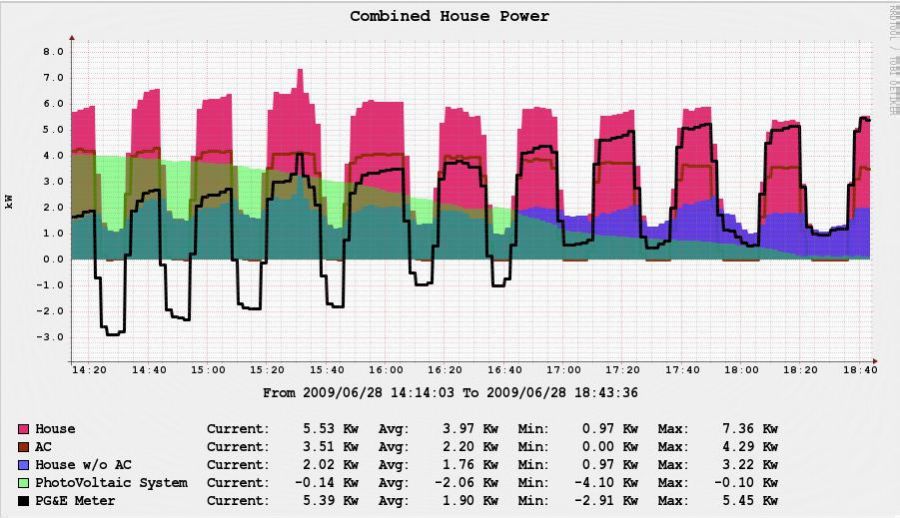
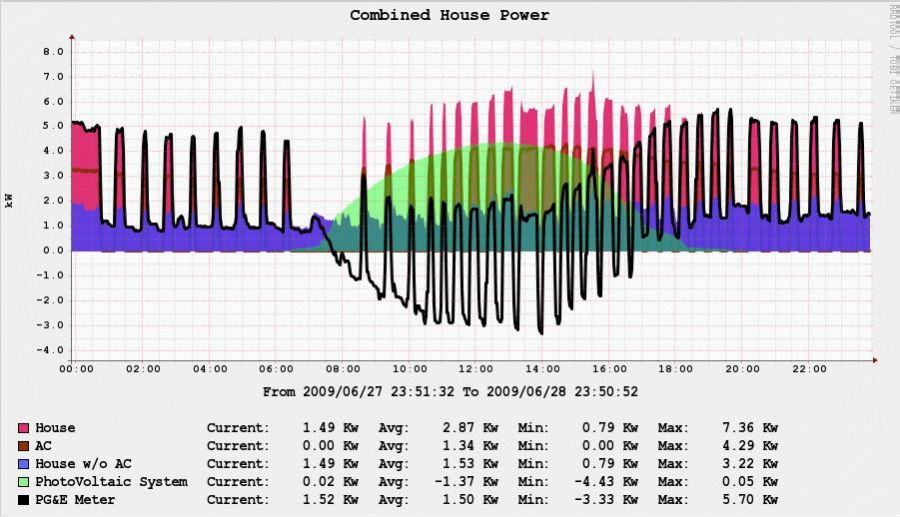
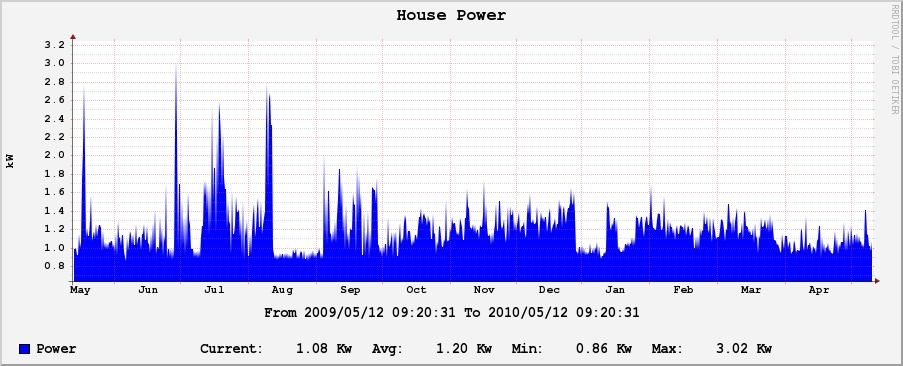
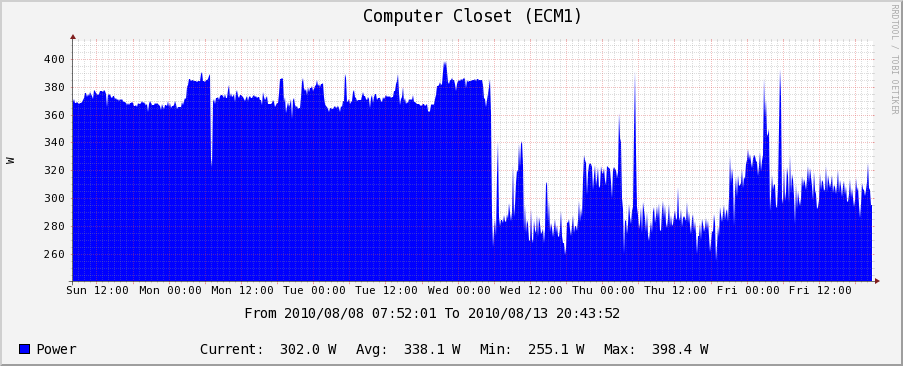
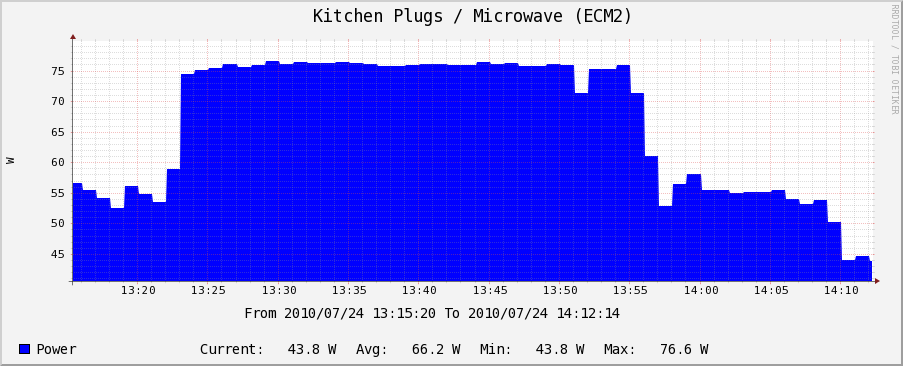
    And for the money shot, all the house uses combined on one graph:

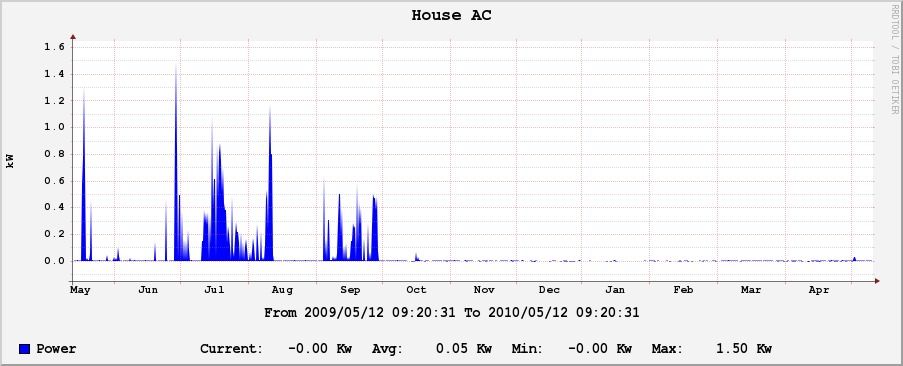
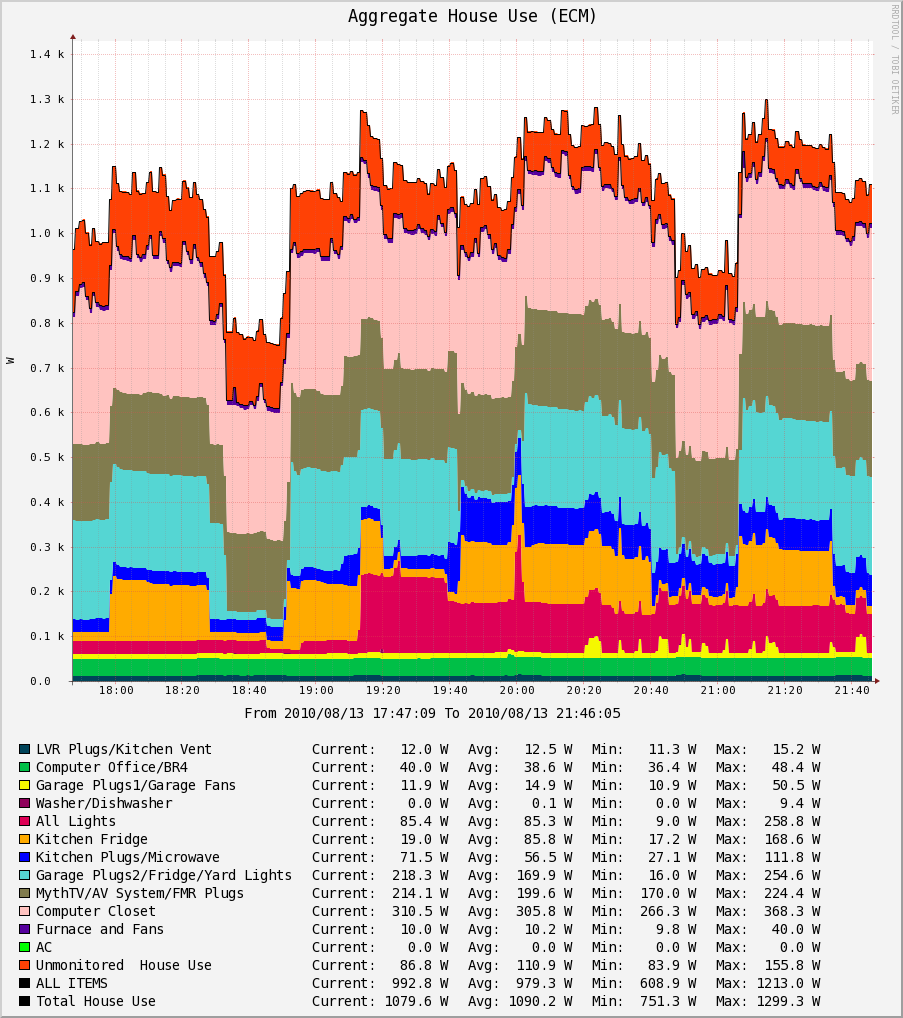
    And the same graph, but with AC that was activated:

    Setting up cacti

    See my cacti config page.

    Now, the tricky part is creating graph items that do not exist (like house use, or unmonitored house use). See this post I made on how to do this.

    The other tricky part is that I had my ECM graphs setup to refresh every 10 seconds, which is faster than the cacti poller which runs every minute. This post explains how I did a faster than 1mn refresh in cacti

    2011/03/11 Two Years of Solar Panels
    π 2011-03-11 01:01 in Solar
    Last year, our production was 8503Kwh for the year, and this year we got an even better 8810Kwh (vs an estimated 8114Kwh yearly by Cobalt Power).

    So far so good :)

    2011/03/29 PGE Trueing Up Encourages Electricity Wasting
    π 2011-03-29 01:01 in Solar
    *Update*: A PG&E employee contacted me after reading this blog, and basically he agreed that the current scheme isn't perfect. He actually said that we're getting creditted a bit too much because the credits do not account for their line transmission charges. I'll admit not fully knowing the gritty details between transmission line charges since I know I do pay a small flat fee for that per month, and by offetting my neighbour's load during high demand sunny hours, I should offload their transmission lines a little bit, but effectively he said that the credits are a little bit too high, which means that you just don't get paid when they get negative.
    While I can see his point, I still don't full agree with that someone who makes more electricity than they make isn't compensated for time of use prices at all, but he also pointed out that it's difficult for people with solar to be fully compensated since they do not provide a contract and guarantee of production, like their other providers do.
    All in all, it's kind of a mess and the current program isn't ideal, but it is better than nothing.

    Original message:

    Dear PG&E,

    We got a solar system on our house based on our use up to the solar system setup. We then managed to save eletricity by making a lot of improvements in our house and we are now in a situation where we do not produce more Kwh than we use after one year, but once you add time of use weight to Kwh (which is what E6B time of use pricing does), we end up with a negative bill, which we get no credit for.

    I've been told that California now does allow people who produce more than they use to get 8c per Kwh produced. This however does not account for time of use, and in our case I was told that we won't be getting a penny of the $38 credit we have with you after a year because we still used 1200Kwh more than we produced (that is correct).

    I find this a weird way to look at Kwh pricing. We all know that all electricity is not created equal and that night and winter electricity is cheaper in California. We also know that solar panel folks like us help you, PG&E, not fire up gas plants to make up for the extra load that happens during peak times in summer. This is why you sell that electricity for more money (although many customers for some reason still get a flat price for electricity, which is unfortunate since you don't entice them to shift their load to cheaper times).

    In our case, with the current law, we are now enticed not only to stop bothering trying to save further electricty, but we're even enticed to start wasting electricity and use more electrical appliances instead of gas ones, because that electricity will be free (we have a $38 credit that we won't get paid for, so we might as well use up that credit and bring it up to 0). I could also do stupid things like running an extension cord to my neighbours, but obviously you don't want me to do that.

    So, can we please fix up the law and just pay net producers like us for the actual credit on their bill up to a certain value if you really need to somehow stop people from producing too much (and I would question that need, but that's a different topic).

    for those who missed the math, here's an example for last year (prices are approximate because TOU makes for fuzzy math, but it's enough to get the idea.

    Last year, we had a $38 credit (about 470Kwh at 8c/Kwh) and 1400Kwh use. If we had:

  • used an extra 500Kwh, our true up bill would have been about $2.40 and we would have paid $2.40 at the end of the year.
  • used an extra 470Kwh, our true up bill would have been about $0 and we would have paid/gotten nothing at the end of the year.
  • saved an extra 1400Kwh, our true up bill would have been about -$150 and we would have gotten nothing at the end of the year.
  • saved an extra 1500Kwh, our true up bill would have been about -$158 and we would have gotten $8 at the end of the year.
  • In other words, for those who are counting, the current pricing method pretty much puts a $150 "hole" where you can use more or save a total of 1800Kwh and your end bill is exactly the same.

    PG&E, this is not a good way to encourage people to be green and save electricity. With our current bill I have no incentive to save any further since I'd have to save a lot to see a single penny. On the other end, we can use about 400kWh (about a month's worth for smaller consumers) and not pay a penny for it.
    PG&E: Please fix this, it's broken.

    For those who are curious, here is our use/balance for 2011:

    .

    2010-2011Total (Kwh)FEB 2011JAN 2011DEC 2010NOV 2010OCT 2010SEP 2010AUG 2010JUL 2010JUN 2010MAY 2010APR 2010MAR 2010

    .

    Summer Peak-7620-19-124-186-156-174-103

    .

    Summer Part Peak-57211-78-100-151-108-107-39

    .

    Summer Off Peak104795332199188185471

    .

    Winter Peak35468787818-165771

    .

    Winter Off Peak11421133314481630-28115

    .

    Total Kwh1209181409526287235-25-149-79-234-15729186

    .

    Total $-$38.80$17.89$39.60$51.27$26.68$11.61-$34.95-$62.18-$32.44-$44.34-$26.49$2.30$12.25

    And here is 2010:

    .

    2009-2010Total (Kwh)FEB 2010JAN 2010DEC 2009NOV 2009OCT 2009SEP 2009AUG 2009JUL 2009JUN 2009MAY 2009APR 2009MAR 2009

    .

    Summer Peak-72520-60-90-151-172-173-99

    .

    Summer Part Peak-531-1-60-106-112-119-113-20

    .

    Summer Off Peak124011028416523025713856

    .

    Winter Peak301767277-1-96323

    .

    Winter Off Peak131741144242216425-16316

    .

    Total Kwh1602487514499292164-31-33-34-148-47-10039

    .

    Total $-$39.87$32.54$34.04$33.45$20.87-$1.63-$19.71-$8.08-$45.81-$55.31-$25.83-$8.13$3.73


    More pages: January 2009 April 2009 November 2009 February 2010 March 2010 May 2010 June 2010 August 2010 March 2011 March 2012 July 2012 March 2013 March 2014 March 2015 March 2018 March 2019

    Contact Email