So in a nutshell, the system performed great so far. Cobalt Power definitely underpromised and over delivered and we're apparently done paying electricity bills from now on.
Here are the not quite yearly graphs (as a reminder you can zoom in by selecting a rectangle with the first mouse button and zoom out with the second button).
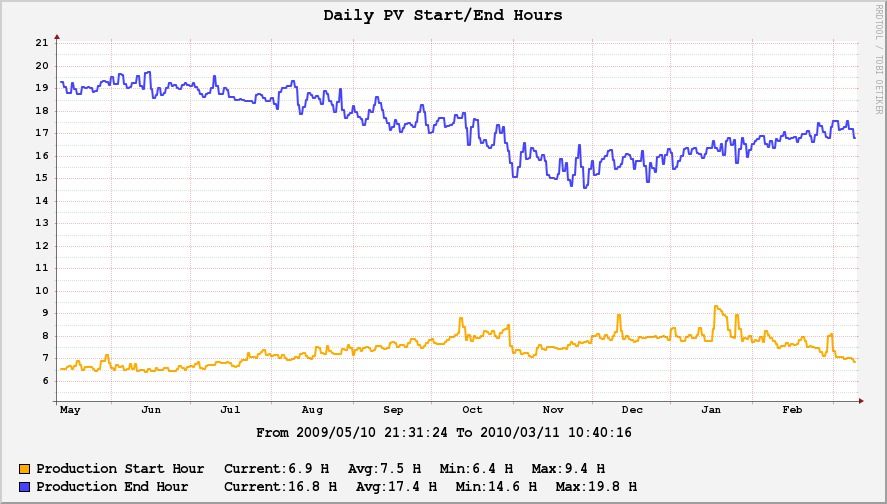
As a slight repost, below is a graph with production start and end (hour the sun starts hitting the panels and when it sets past the roof). Note the one hour jump on Nov 1st because of the daily savings change.
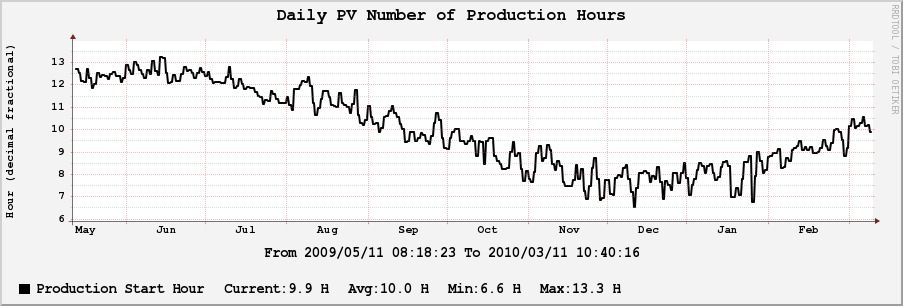
Production hours:
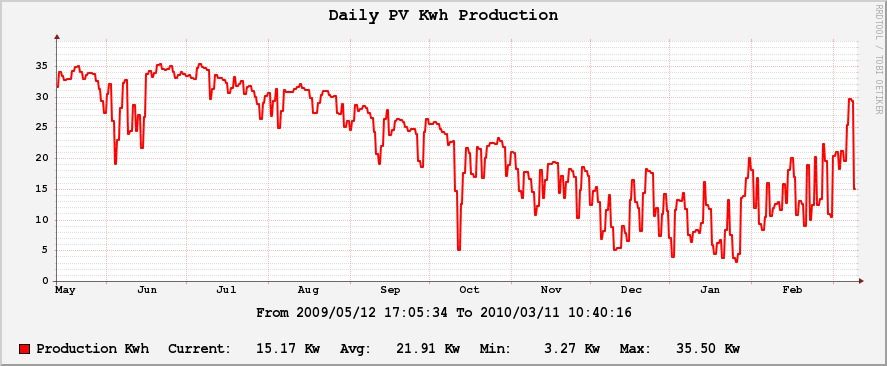
Production Kwh (nice to see that March is getting a lot more sun):
Last, but not least this page lets you get all the daily starts (note, you need to change the top preset to 3, 6, or 12 months to get useful data, last day doesn't show anything).