π
2010-03-11 01:01
in Computers, Linuxha, Solar
Today is the one year anniversary of the Solar Panels Turnup, so I thought I'd gather a few stats to see how they did (unfortunately the full house monitoring system only became active more than 2 months later, so I don't have full stats).
Cobalt Power Estimated the panels yearly production at 8114Kwh for a year. I was a bit apprehensive during the quotes because of our weirdly shaped roof and shading issues from nearby trees, but in the end we got exactly 8700Kwh a year later, or almost a 600Kwh production beyond the estimate. Great!
Cobalt Power estimated our federal tax credit to $11,235 (the CA tax rebate is directly taken off the initial bill). I just got my taxes done and our tax credit was $11,746. this made the panels around $500 cheaper than quoted. Great again! :)
According to PG&E, we used around 1600Kwh since last year (i.e. we used about 1.5 months' worth of electricity), but due to the time of use credits (summer daytime electricity that we mostly produce is worth more than night and winter electricity), we actually got a $40 credit for the year, so we won't owe them anything outside of the monthly connection charge ($10, which is much cheaper than batteries and being off-grid). This year the $40 is lost but next year, they'll actually owe us whatever credit we get (i.e. we get a check back).
At this rate, we should break even in 5 years.
So in a nutshell, the system performed great so far. Cobalt Power definitely underpromised and over delivered and we're apparently done paying electricity bills from now on.
Here are the not quite yearly graphs (as a reminder you can zoom in by selecting a rectangle with the first mouse button and zoom out with the second button).
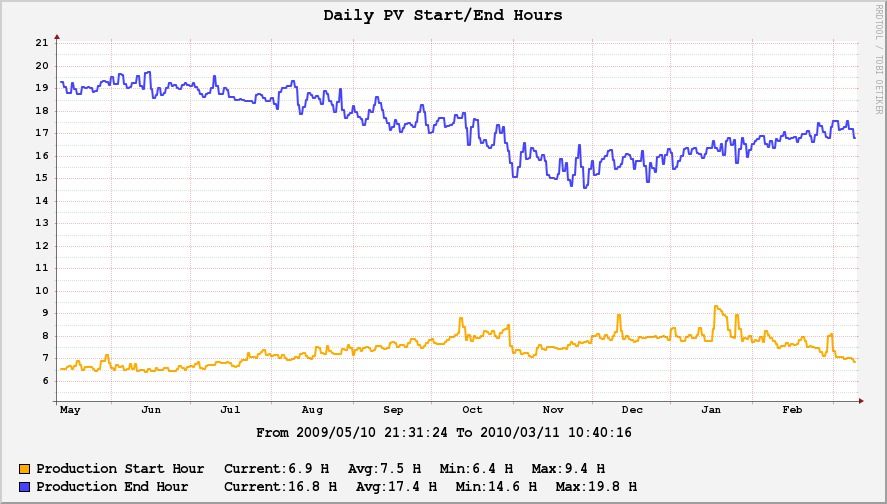
As a slight repost, below is a graph with production start and end (hour the sun starts hitting the panels and when it sets past the roof). Note the one hour jump on Nov 1st because of the daily savings change.
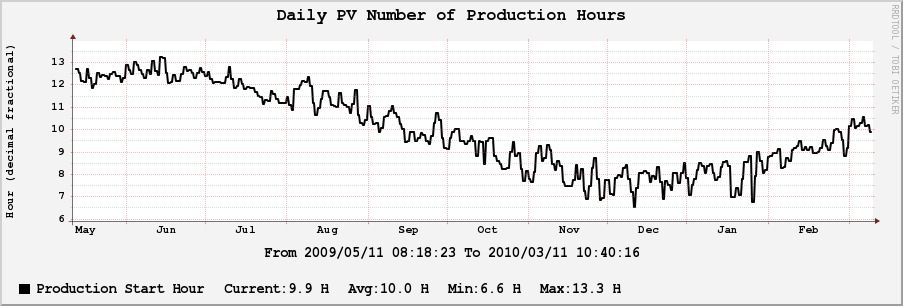
Production hours:
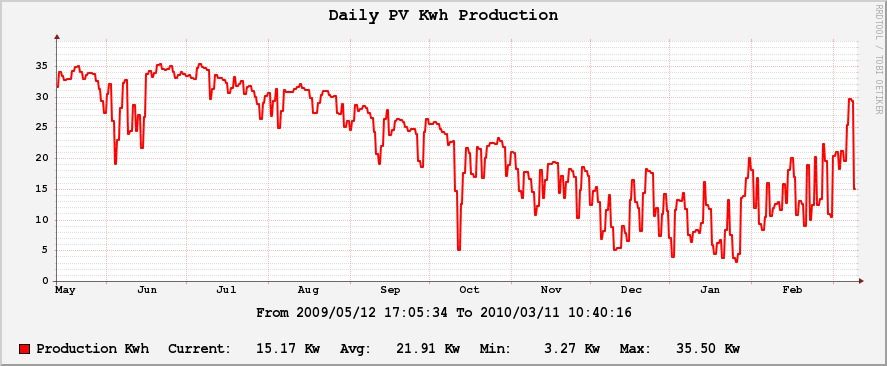
Production Kwh (nice to see that March is getting a lot more sun):
Last, but not least this page lets you get all the daily starts (note, you need to change the top preset to 3, 6, or 12 months to get useful data, last day doesn't show anything). |